Task 13 - Run a CI/CD pipeline
Estimated Time to Complete: ~20 minutes
You must finish Task 12 before starting Task 13
The GitLab pipeline you're about to trigger manages the same lab devices
Terraform has been managing locally. If both environments hold state for
those devices at the same time, every pipeline run fights your local
terraform apply (and vice versa), producing symptoms like "I deployed
a banner but it reverted 30 seconds later." terraform destroy in Task
12 removes the local state so GitLab becomes the single source of truth
from here on.
Self-check - run this in your WSL terminal from ~/nac-iosxe/:
- No output - perfect, local state is empty, proceed.
- Any output at all - Task 12 hasn't been run (or didn't finish).
Run
terraform destroyand answeryesbefore you continue.
Up until now you've been driving Terraform manually: init, plan, apply. That's fine for learning, but production teams run the same workflow through CI/CD so every change is validated, previewed, applied, and tested the same way - without a human typing commands. In this task you'll do exactly that using a pre-configured GitLab pipeline.
What you'll learn
By the end of this task you will have:
- Navigated the
netascode/nac-iosxe-terraformGitLab project and read its.gitlab-ci.yml - Committed a change via the GitLab Web IDE and watched the pipeline trigger automatically
- Observed a complete pipeline run (validate → plan → deploy → notify) and verified the deployed change on the lab devices
CI/CD for Network as Code
The lab ships with a pre-configured GitLab repository containing your Network as Code project and a ready-to-run CI/CD pipeline. Every push or merge request triggers a pipeline that runs the same five stages you just performed by hand - plus a few you didn't:
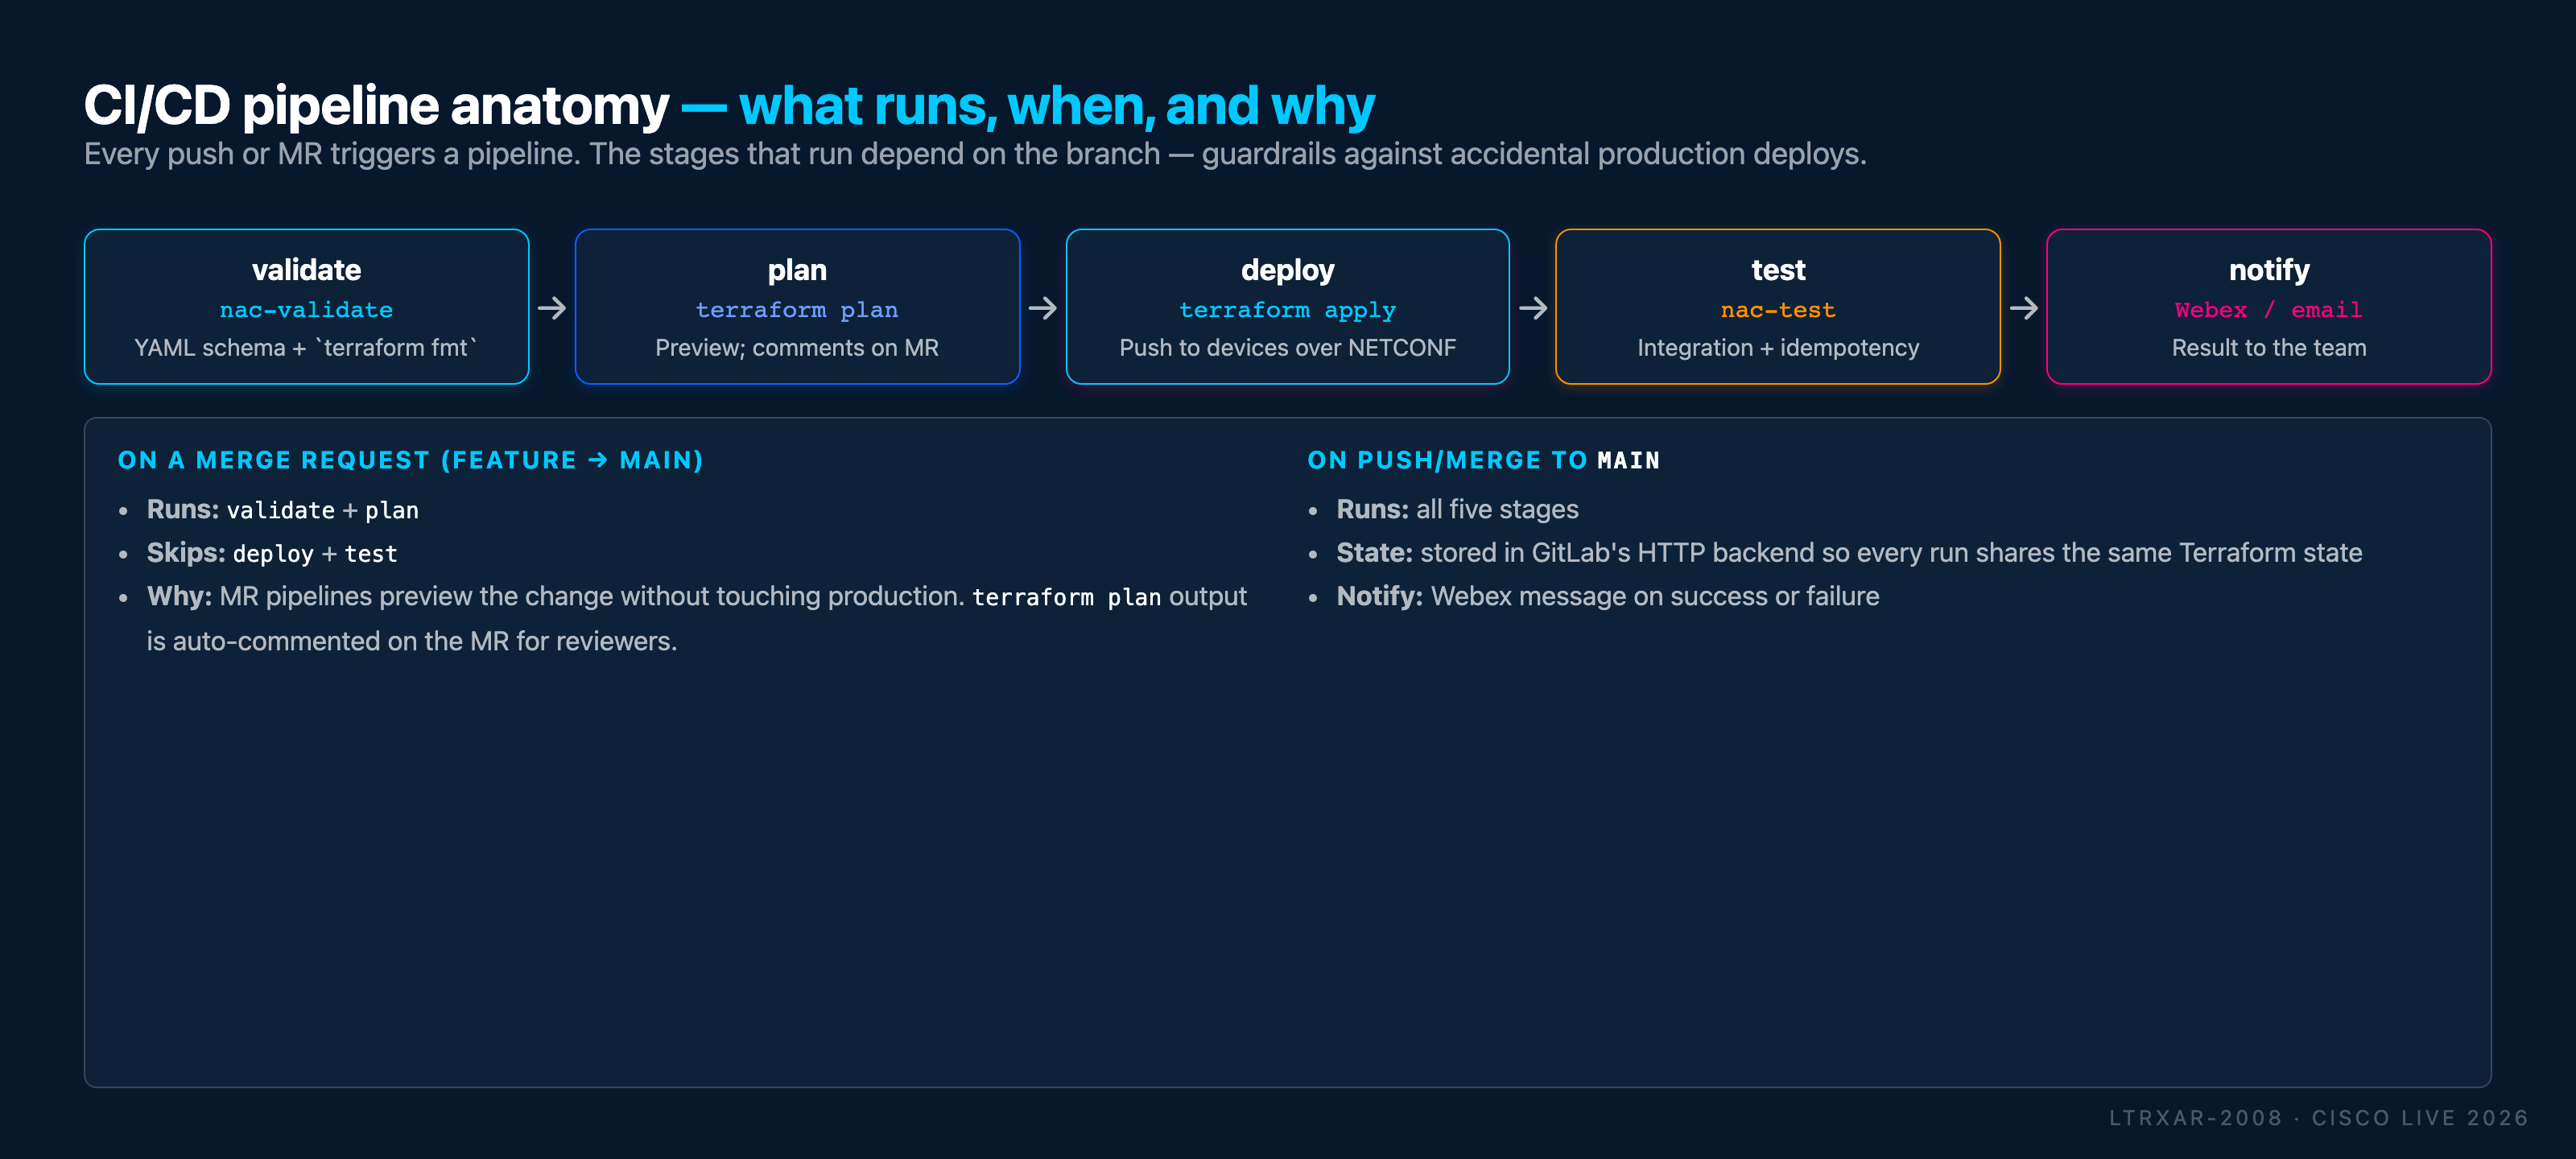
Two important behaviors to notice before we run one:
- Merge-request pipelines only preview - they run
validate+planand post the plan diff as an MR comment. They never touch the devices. This is the guardrail that makes code review meaningful. - Main-branch pipelines actually deploy - they run all five stages (
validate→plan→deploy→test→notify). Merging tomainis the act that commits a change to the real network.
Same pipeline definition, different behavior per branch - a simple pattern that gives you a preview environment for free.
Step 1: Access GitLab
Use the browser inside your RDP session
GitLab is only reachable from within the lab environment. Open the URL below in Chrome inside your RDP session (the Windows 10 VM) - it will not load from your local machine.
In Chrome, navigate to GitLab - open the following link in a new tab:
Certificate Warning
You may see a security warning because the lab uses a self-signed certificate. Click Advanced and then Proceed to 198.18.133.101 to continue.
If prompted, log in with credentials: Username: root / Password: C1sco12345
Step 2: Navigate to the NaC-IOSXE project
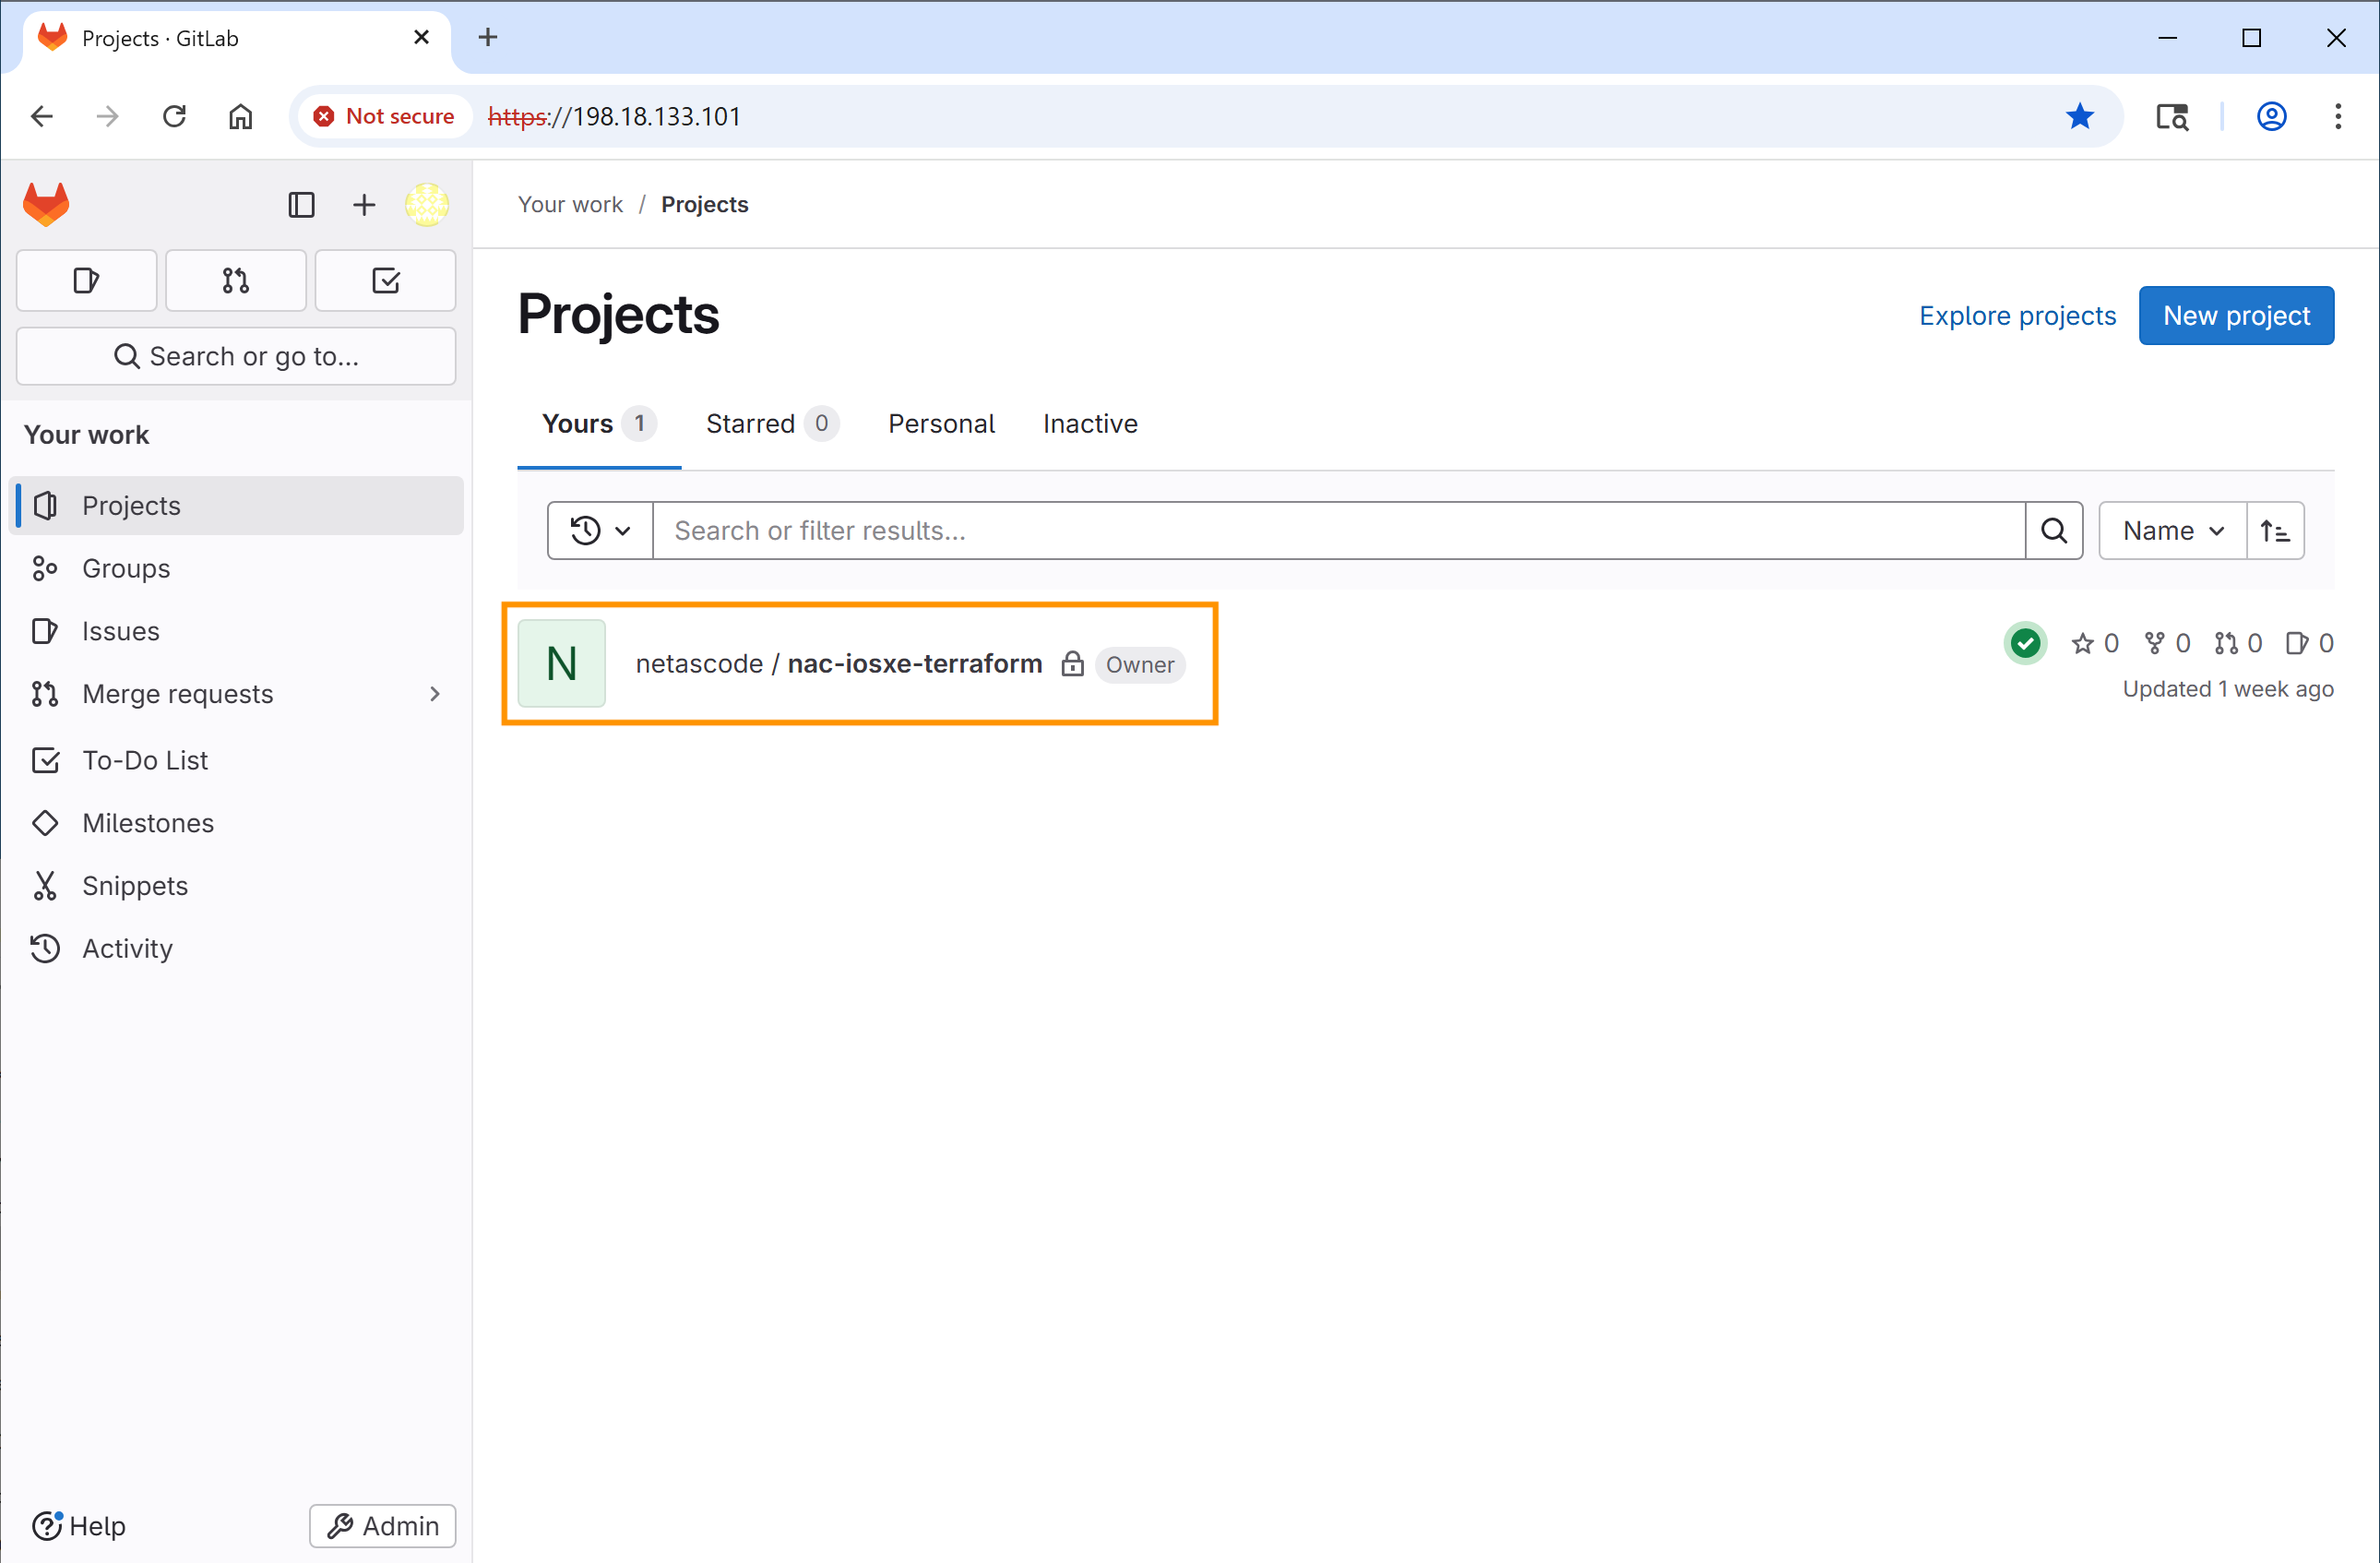
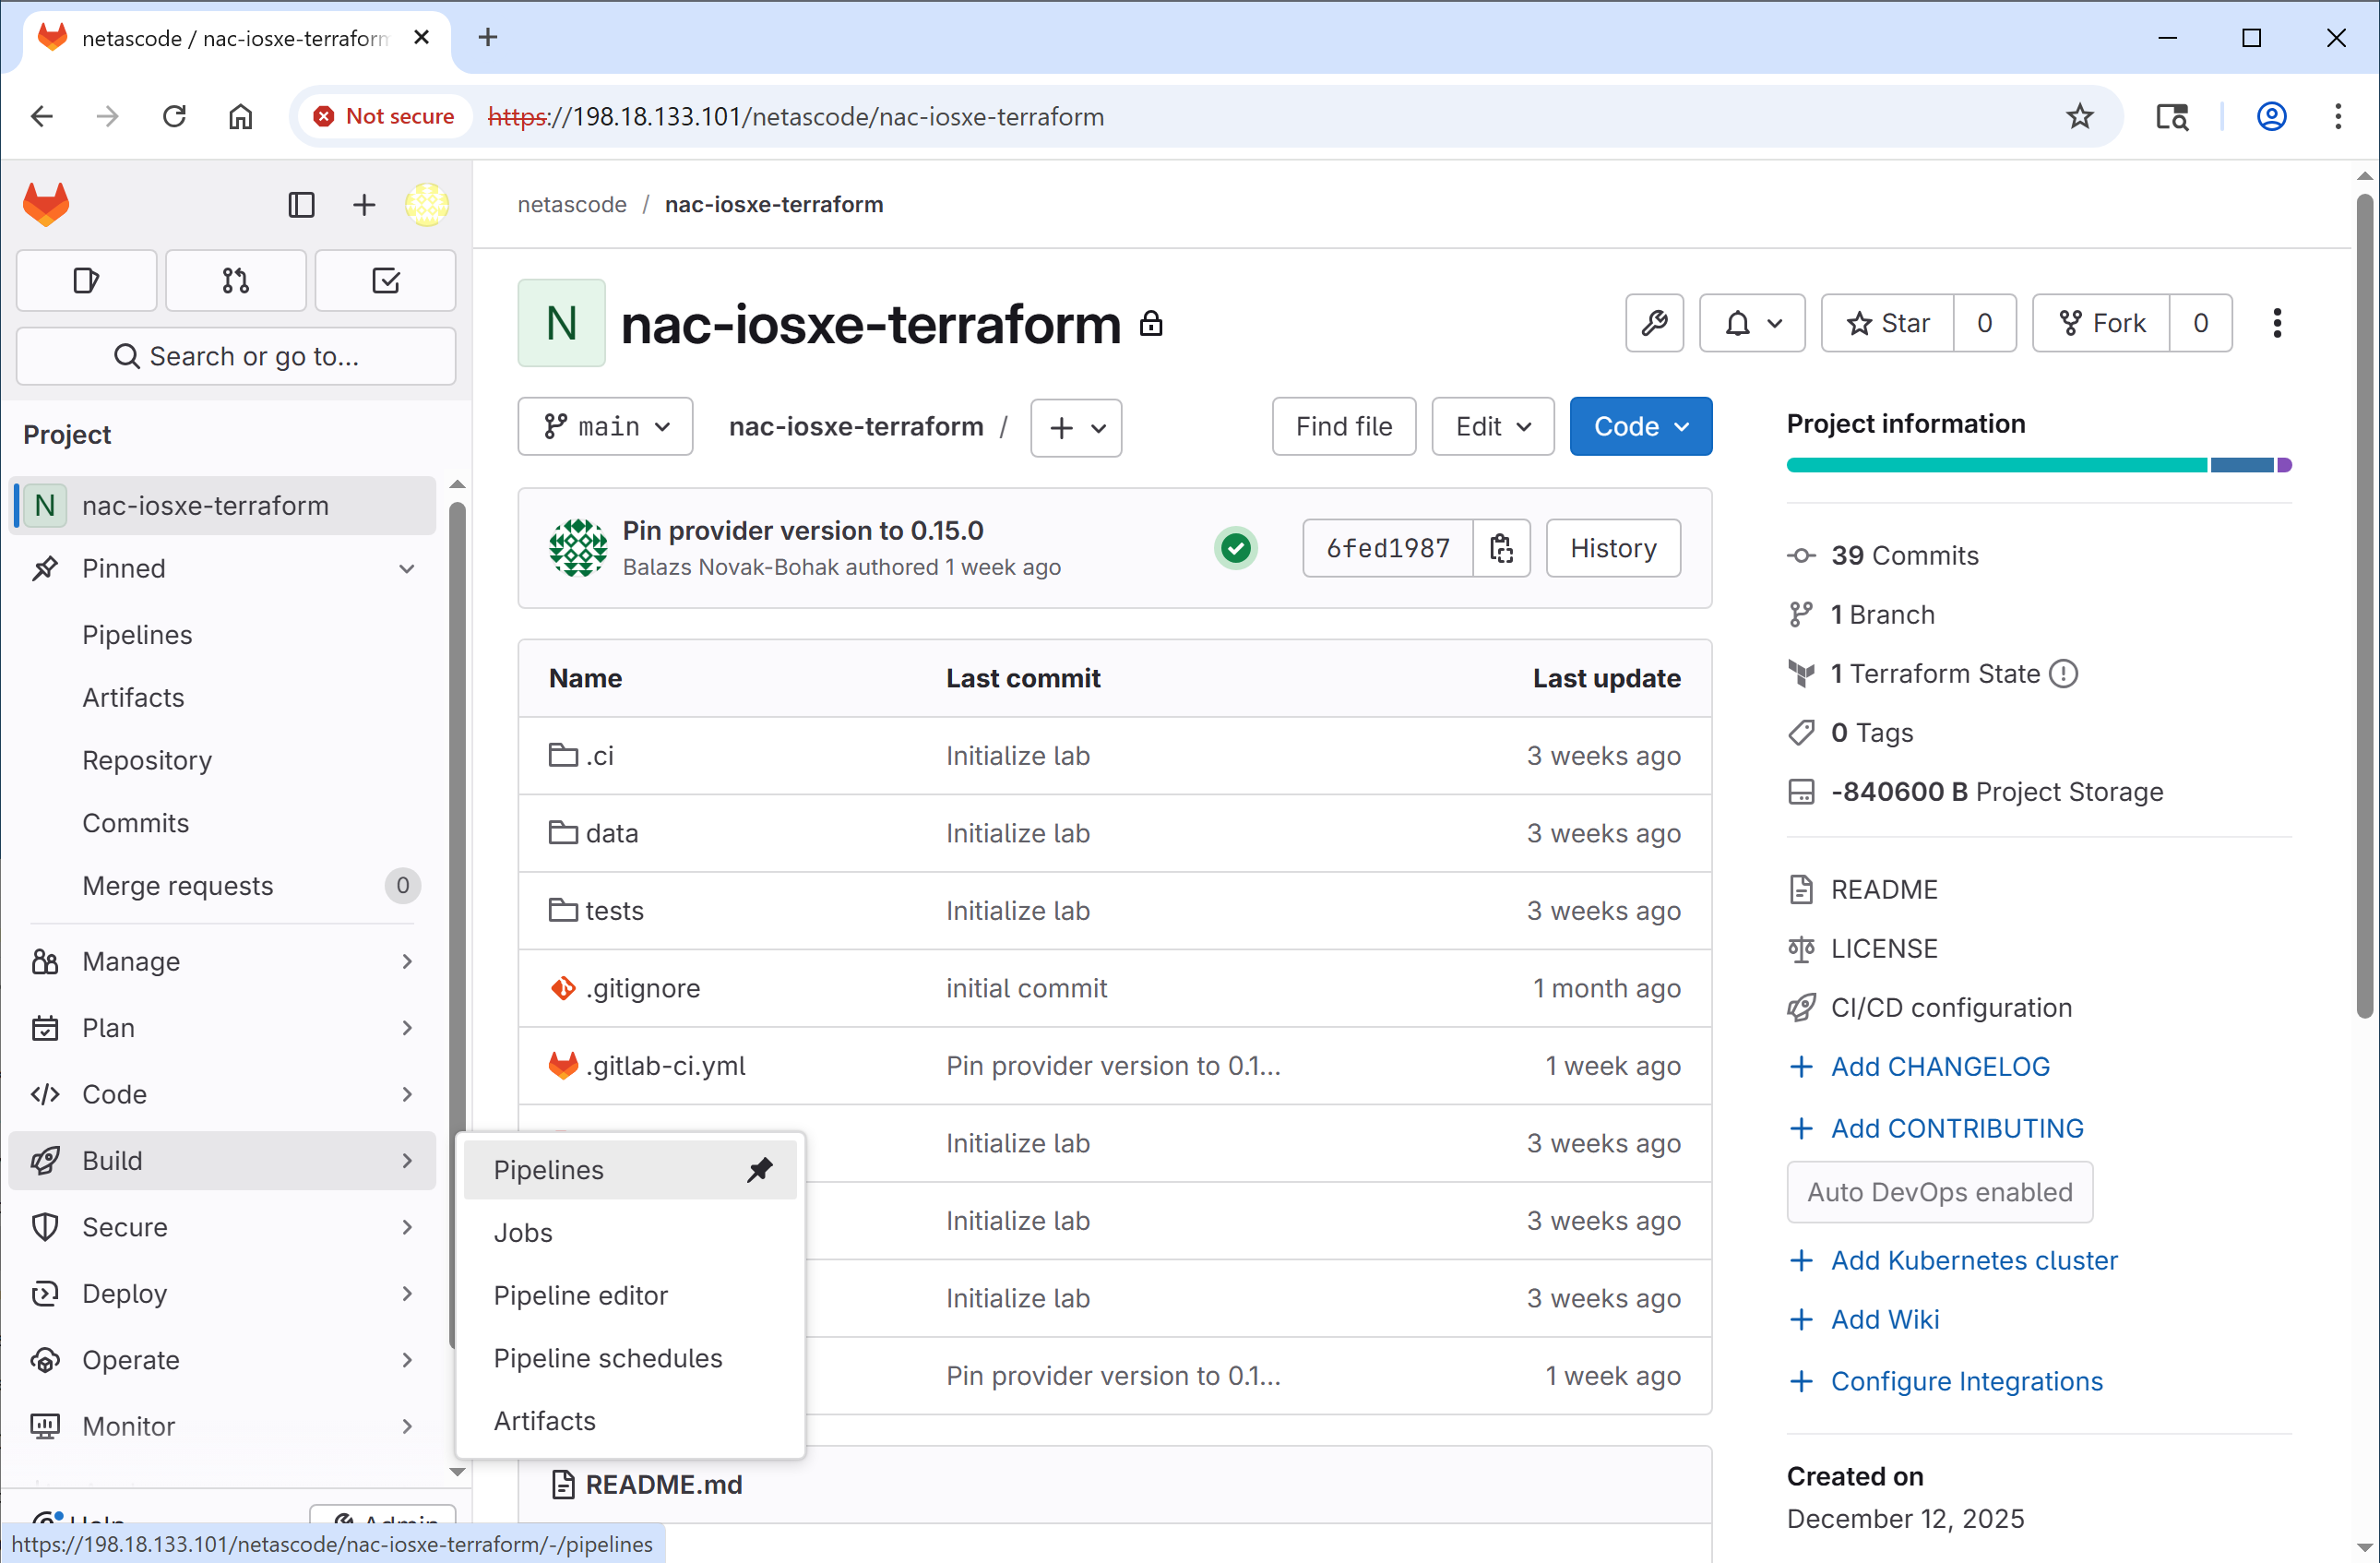
After logging in, you'll see the GitLab dashboard. Click on the netascode/nac-iosxe-terraform project to open it.
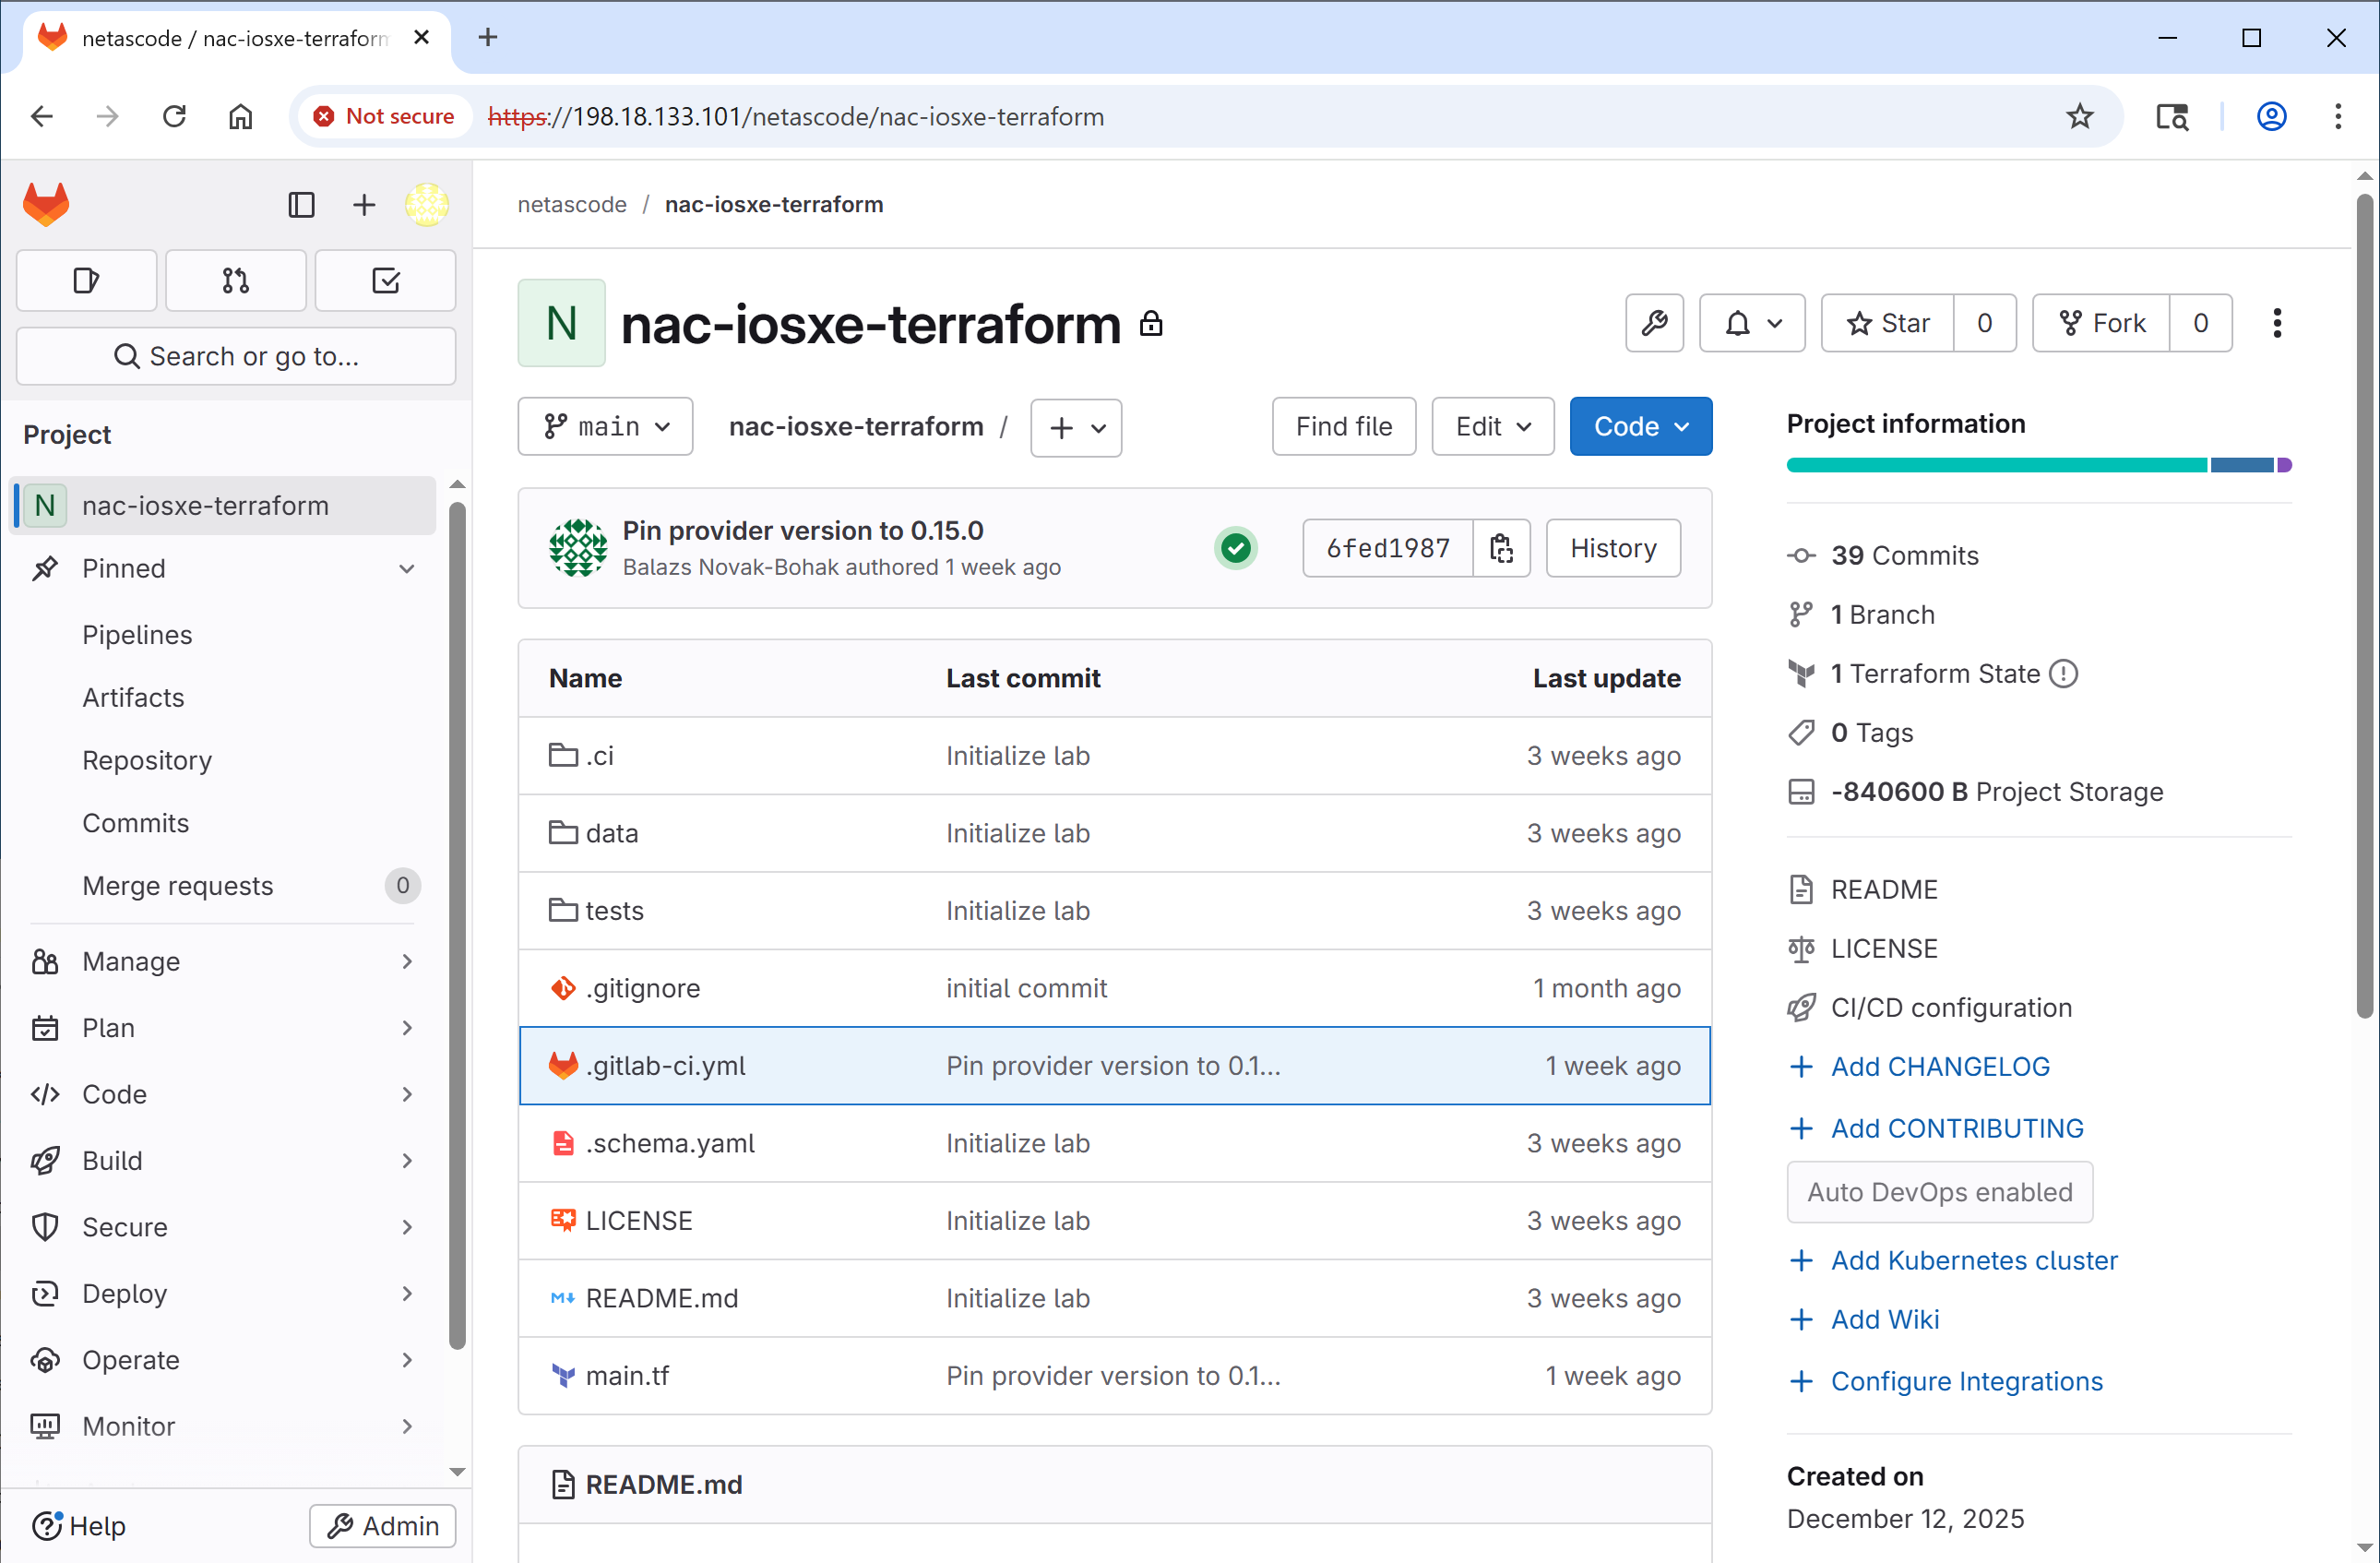
The project page shows your repository files, including:
data/folder with your YAML configurations - Same as you created in Task 02tests/folder with your ROBOT tests - Same as the ACL tests from optional Task 11main.tf- Terraform configuration - Same as you created in Task 02.schema.yaml- The Network as Code for IOS XE schema - Same as you used in Task 10.gitlab-ci.yml- CI/CD pipeline definition file - This is new!
CI/CD pipeline configuration
Before running the pipeline, understand how it's configured first. Click on .gitlab-ci.yml to view the pipeline definition:
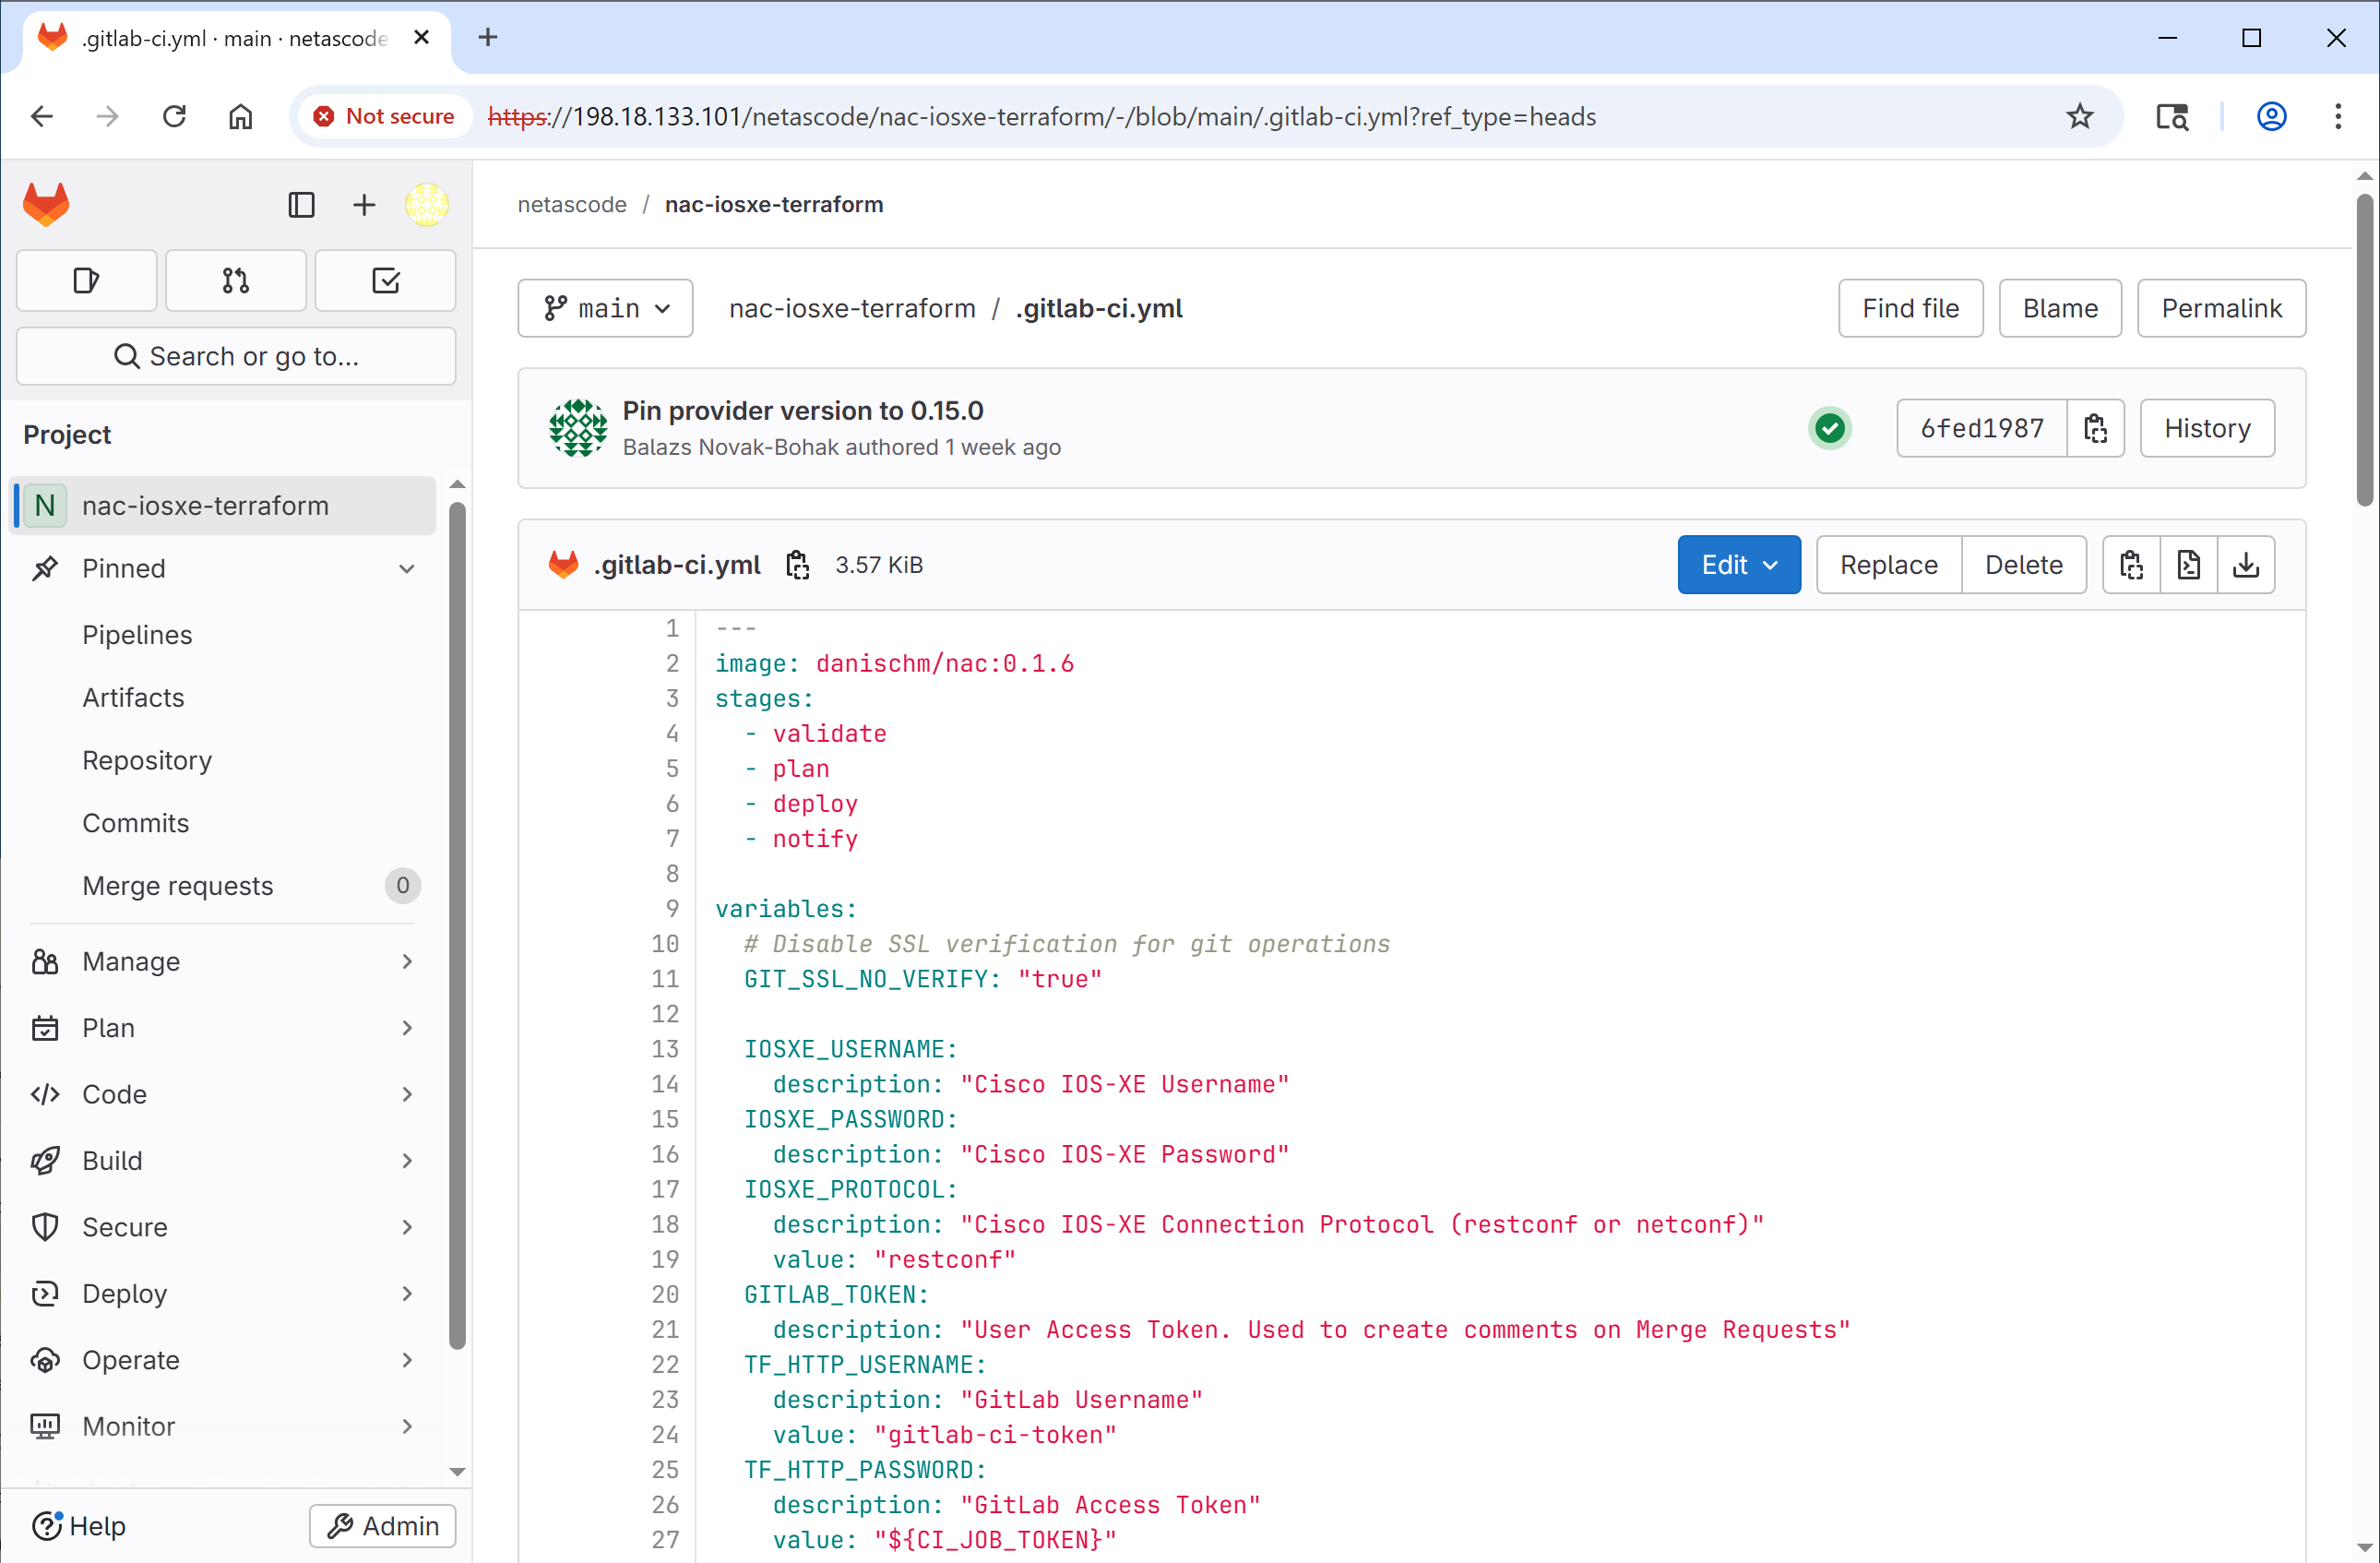
A CI/CD pipeline is an automated workflow of tasks that enables changes to be deployed in a consistent and repeatable manner. This lab leverages pipelines to automate the tasks you previously performed manually. This pipeline example includes the following stages: validate, plan, deploy, and notify.
image: danischm/nac:0.1.6
stages:
  - validate
  - plan
  - deploy
  - notify

variables:
  IOSXE_USERNAME:
    description: "Cisco IOS XE Username"
  IOSXE_PASSWORD:
    description: "Cisco IOS XE Password"
  # ... additional variables for GitLab tokens, Terraform state, Webex notifications ...

cache:
  key: terraform_modules_and_lock
  paths:
    - .terraform
    - .terraform.lock.hcl
    - defaults.yaml
    - model.yaml

validate:
  stage: validate
  script:
    - set -o pipefail && terraform fmt -check |& tee fmt_output.txt
    - set -o pipefail && nac-validate ./data/ |& tee validate_output.txt
  # ... artifacts and rules configuration ...

plan:
  stage: plan
  script:
    - terraform init -upgrade -input=false
    - terraform plan -out=plan.tfplan -input=false
    - terraform show -no-color plan.tfplan > plan.txt
    # ... additional plan output processing ...
  # ... artifacts, dependencies, and branch rules ...

deploy:
  stage: deploy
  script:
    - terraform init -input=false
    - terraform apply -input=false -auto-approve plan.tfplan
  # ... runs only on main branch ...

failure:
  stage: notify
  script:
    - python3 .ci/webex-notification-gitlab.py -f
  when: on_failure

success:
  stage: notify
  script:
    - python3 .ci/webex-notification-gitlab.py -s
  when: on_success
Abbreviated View
The YAML above shows the key structure of .gitlab-ci.yml. The actual file (~150 lines) includes additional configuration for variables, artifacts, caching, and branch rules. You can view the complete file in the GitLab repository.
Key concepts:
- image - Uses a pre-built Docker container with Terraform,
nac-validate, and other tools - stages - Define the order of execution (validate → plan → deploy → notify)
- variables - Pipeline variables for credentials (IOS XE, GitLab), entered at runtime
- cache - Preserves Terraform modules and state between pipeline runs
- validate - Runs
terraform fmtcheck andnac-validateschema validation - plan - Creates the Terraform execution plan and generates reports
- deploy - Applies the configuration automatically (runs on main branch only)
- failure/success - Send Webex notifications based on pipeline outcome
Webex Notifications
The notify job typically use a Python script to send messages to a Webex room. In this lab, this functionality is intentionally omitted, the notify stage is only included as a placeholder for demonstration purposes.
If you're interested in implementing notifications, reach out to your instructors for guidance.
View existing pipelines
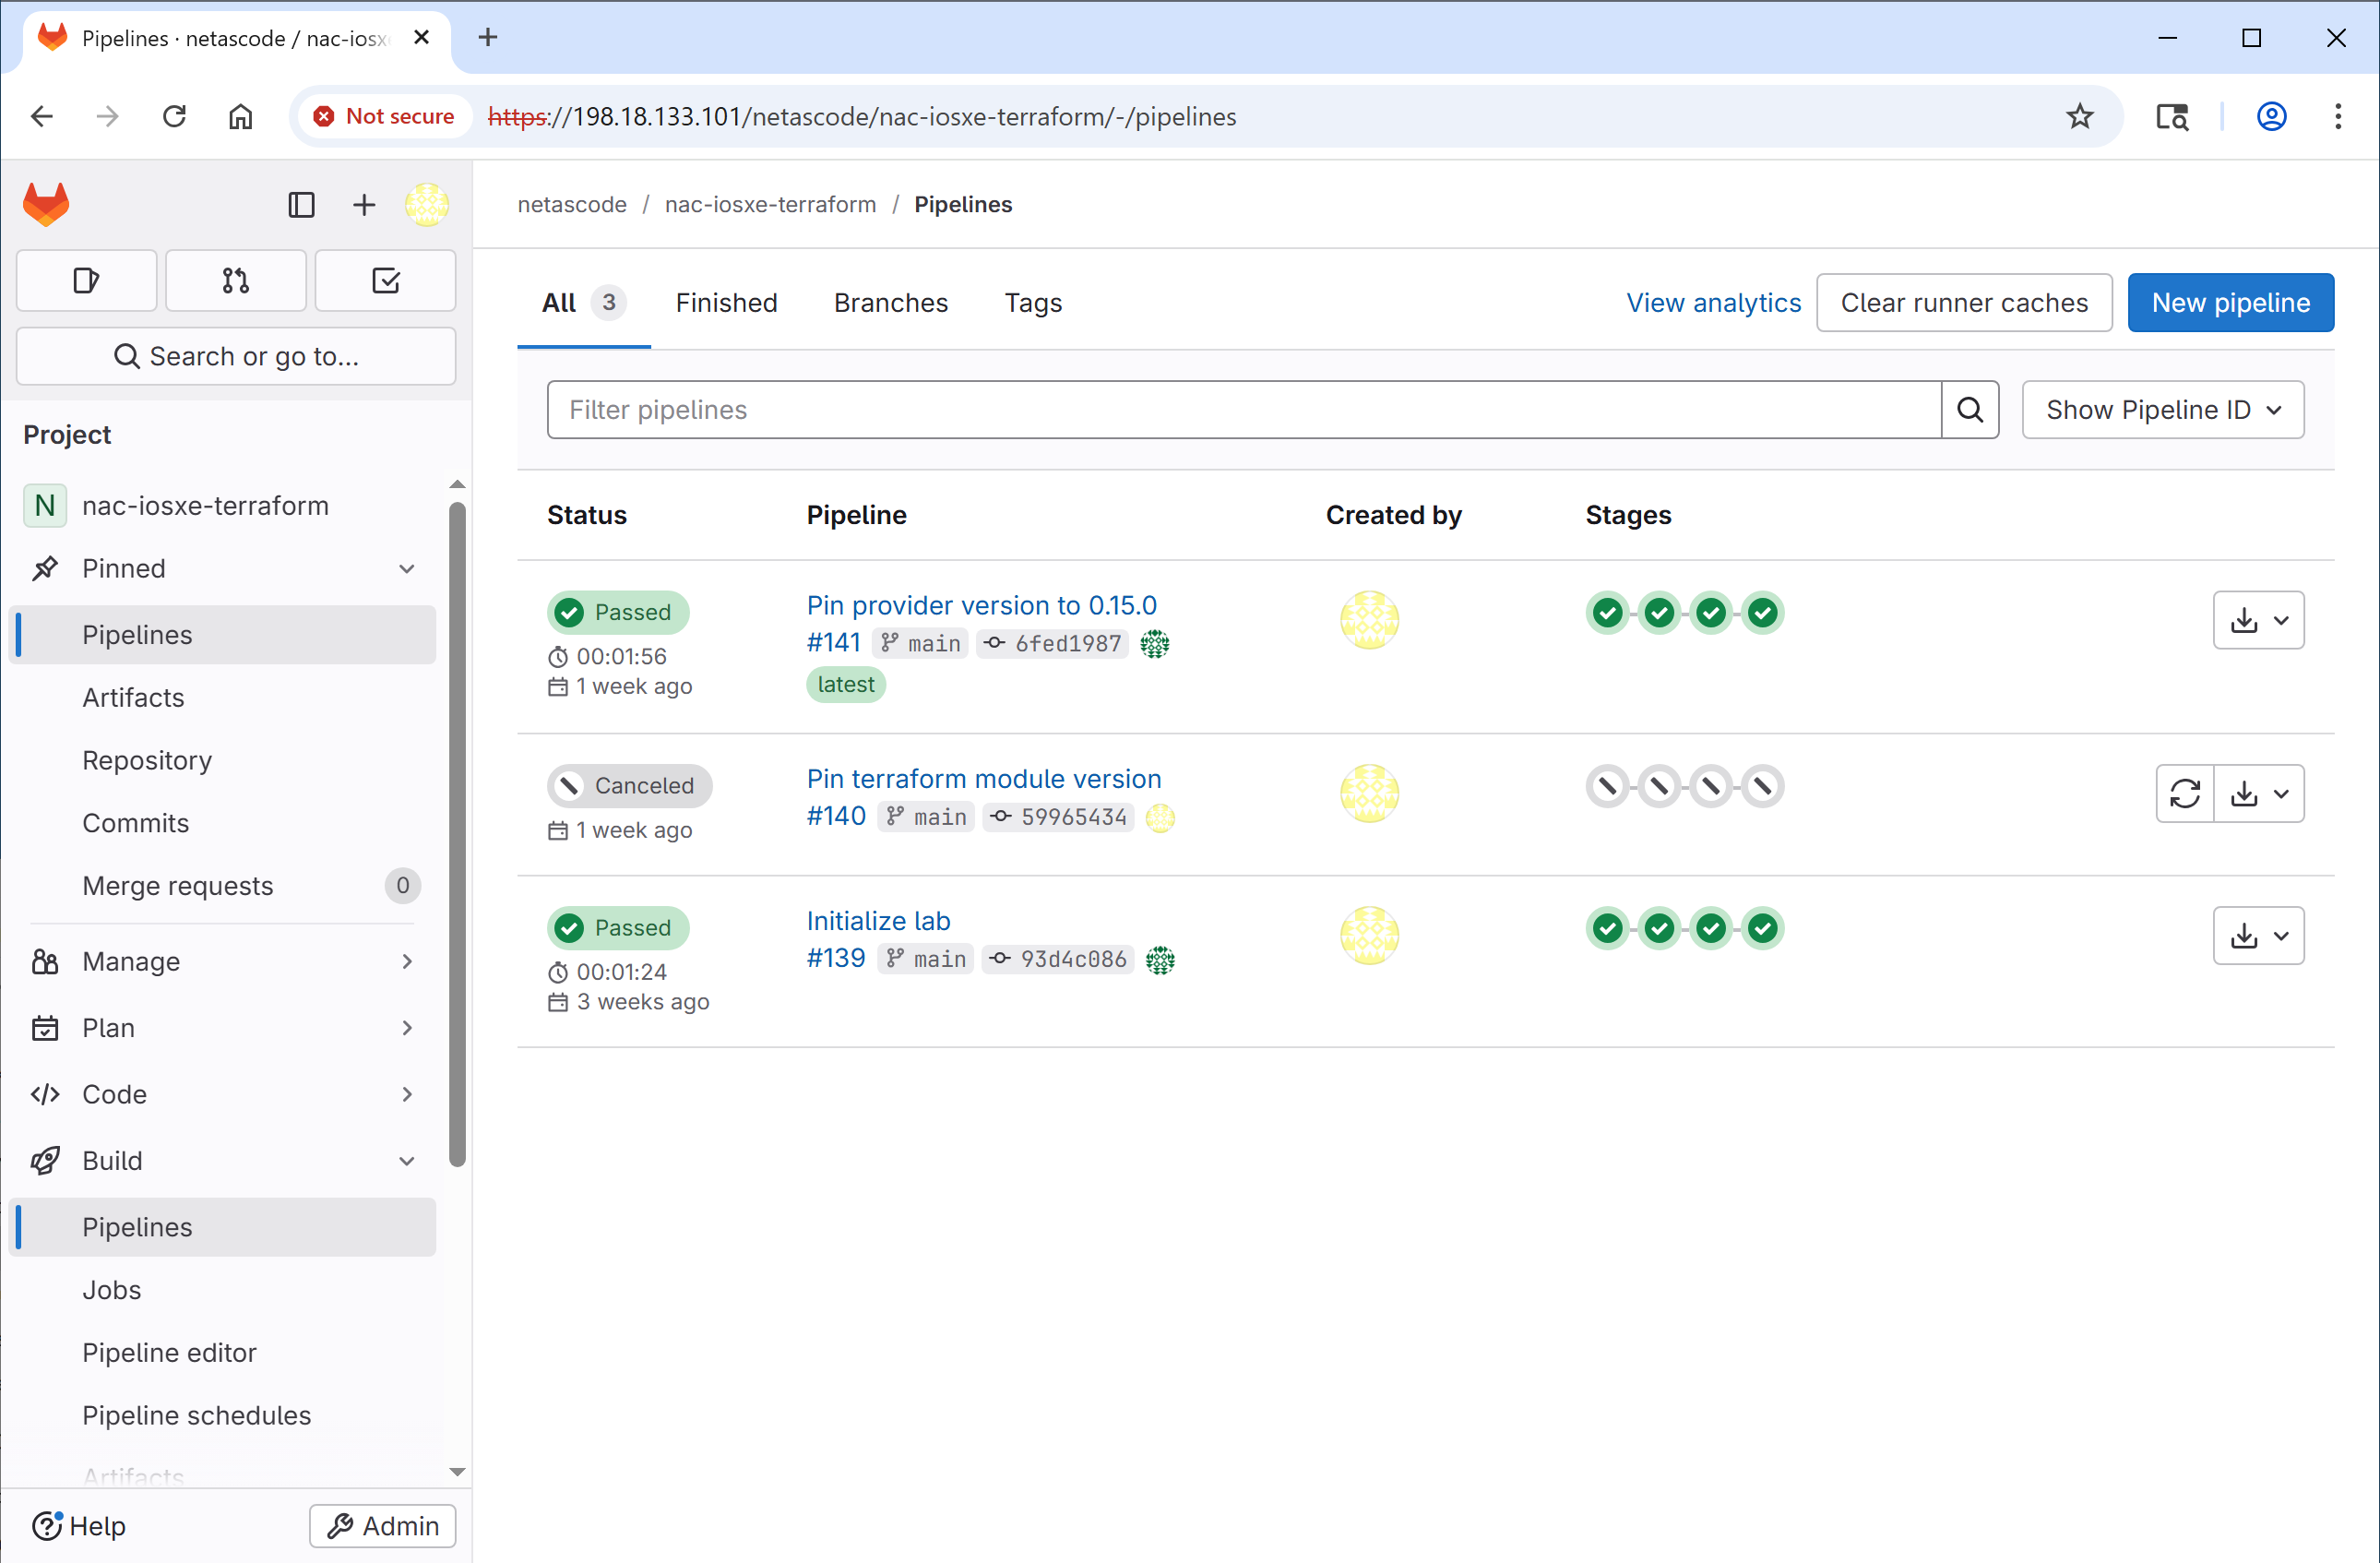
To see the pipeline history, navigate to Build → Pipelines in the left sidebar.
You'll see a list of past pipeline runs with their status (passed, failed, running).
State file management
Navigate to Home (GitLab icon in the top left), select netascode/nac-iosxe-terraform, then open the main.tf file.
The pipeline uses GitLab's http backend to store the Terraform state file on the GitLab server. This allows multiple pipeline runs to share the same state, ensuring consistency across deployments.
It is configured in the main.tf file with the following backend block under the terraform section:
Certificate Verification
The skip_cert_verification = true setting is used here because the lab environment uses self-signed certificates. In production, you should use valid certificates.
For more details on how this is set up, refer to the GitLab Docs.
Step 3: Make a change
This step deploys real configuration to the lab devices
The moment you commit to main, the pipeline's deploy stage runs terraform apply against the CML devices over NETCONF - exactly like you did by hand in Task 03. The first pipeline run after Task 12 will re-push global + per-device config to all four switches. That's expected here (the whole point of Task 13) but worth naming explicitly: you are about to trigger a real device change from a web UI. In production, this is exactly the power commit-to-main protected branches are meant to gate (Task 15 covers that).
The best way to see the CI/CD pipeline in action is to make a configuration change. You'll add the global configuration (from Task 03 - Global Configuration and Task 06 - Variables). This includes the login banner and hostnames. To edit the configuration files, you'll use GitLab's built-in Web IDE - an editor similar to VS Code that runs directly in your browser.
Open the web IDE
- From the project page, click the Edit dropdown button (with a pencil icon)
- Select Web IDE
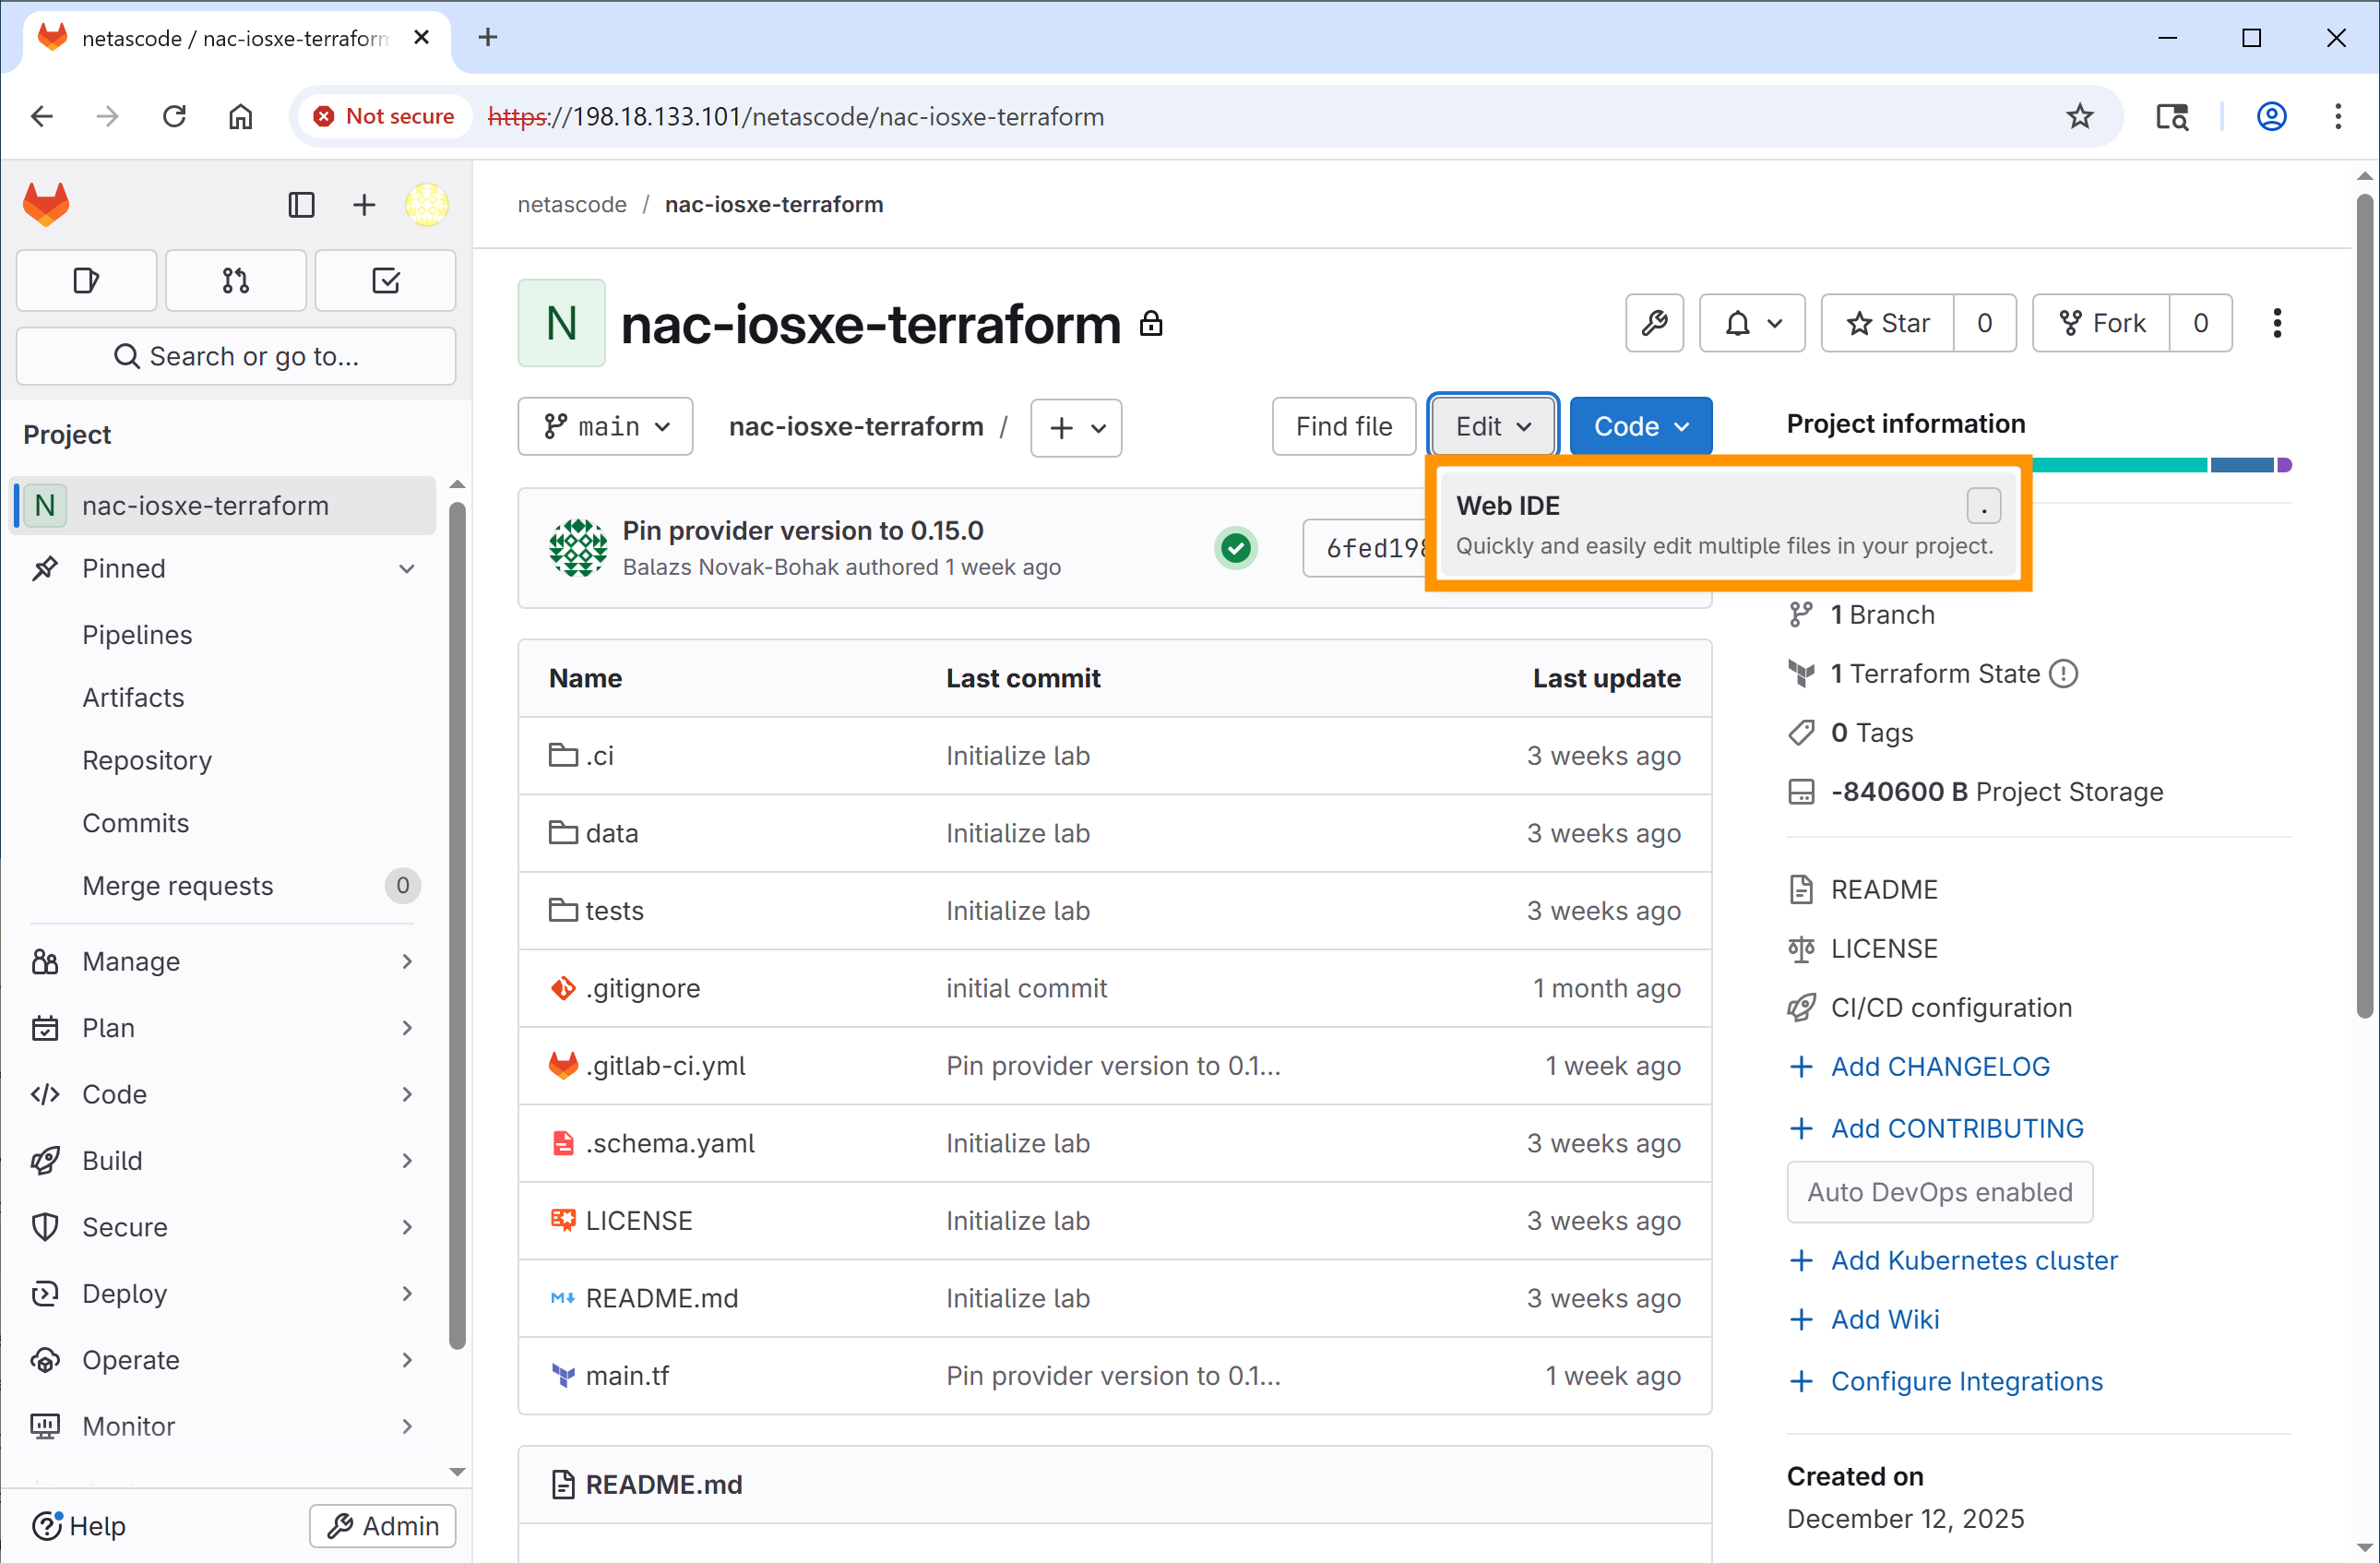
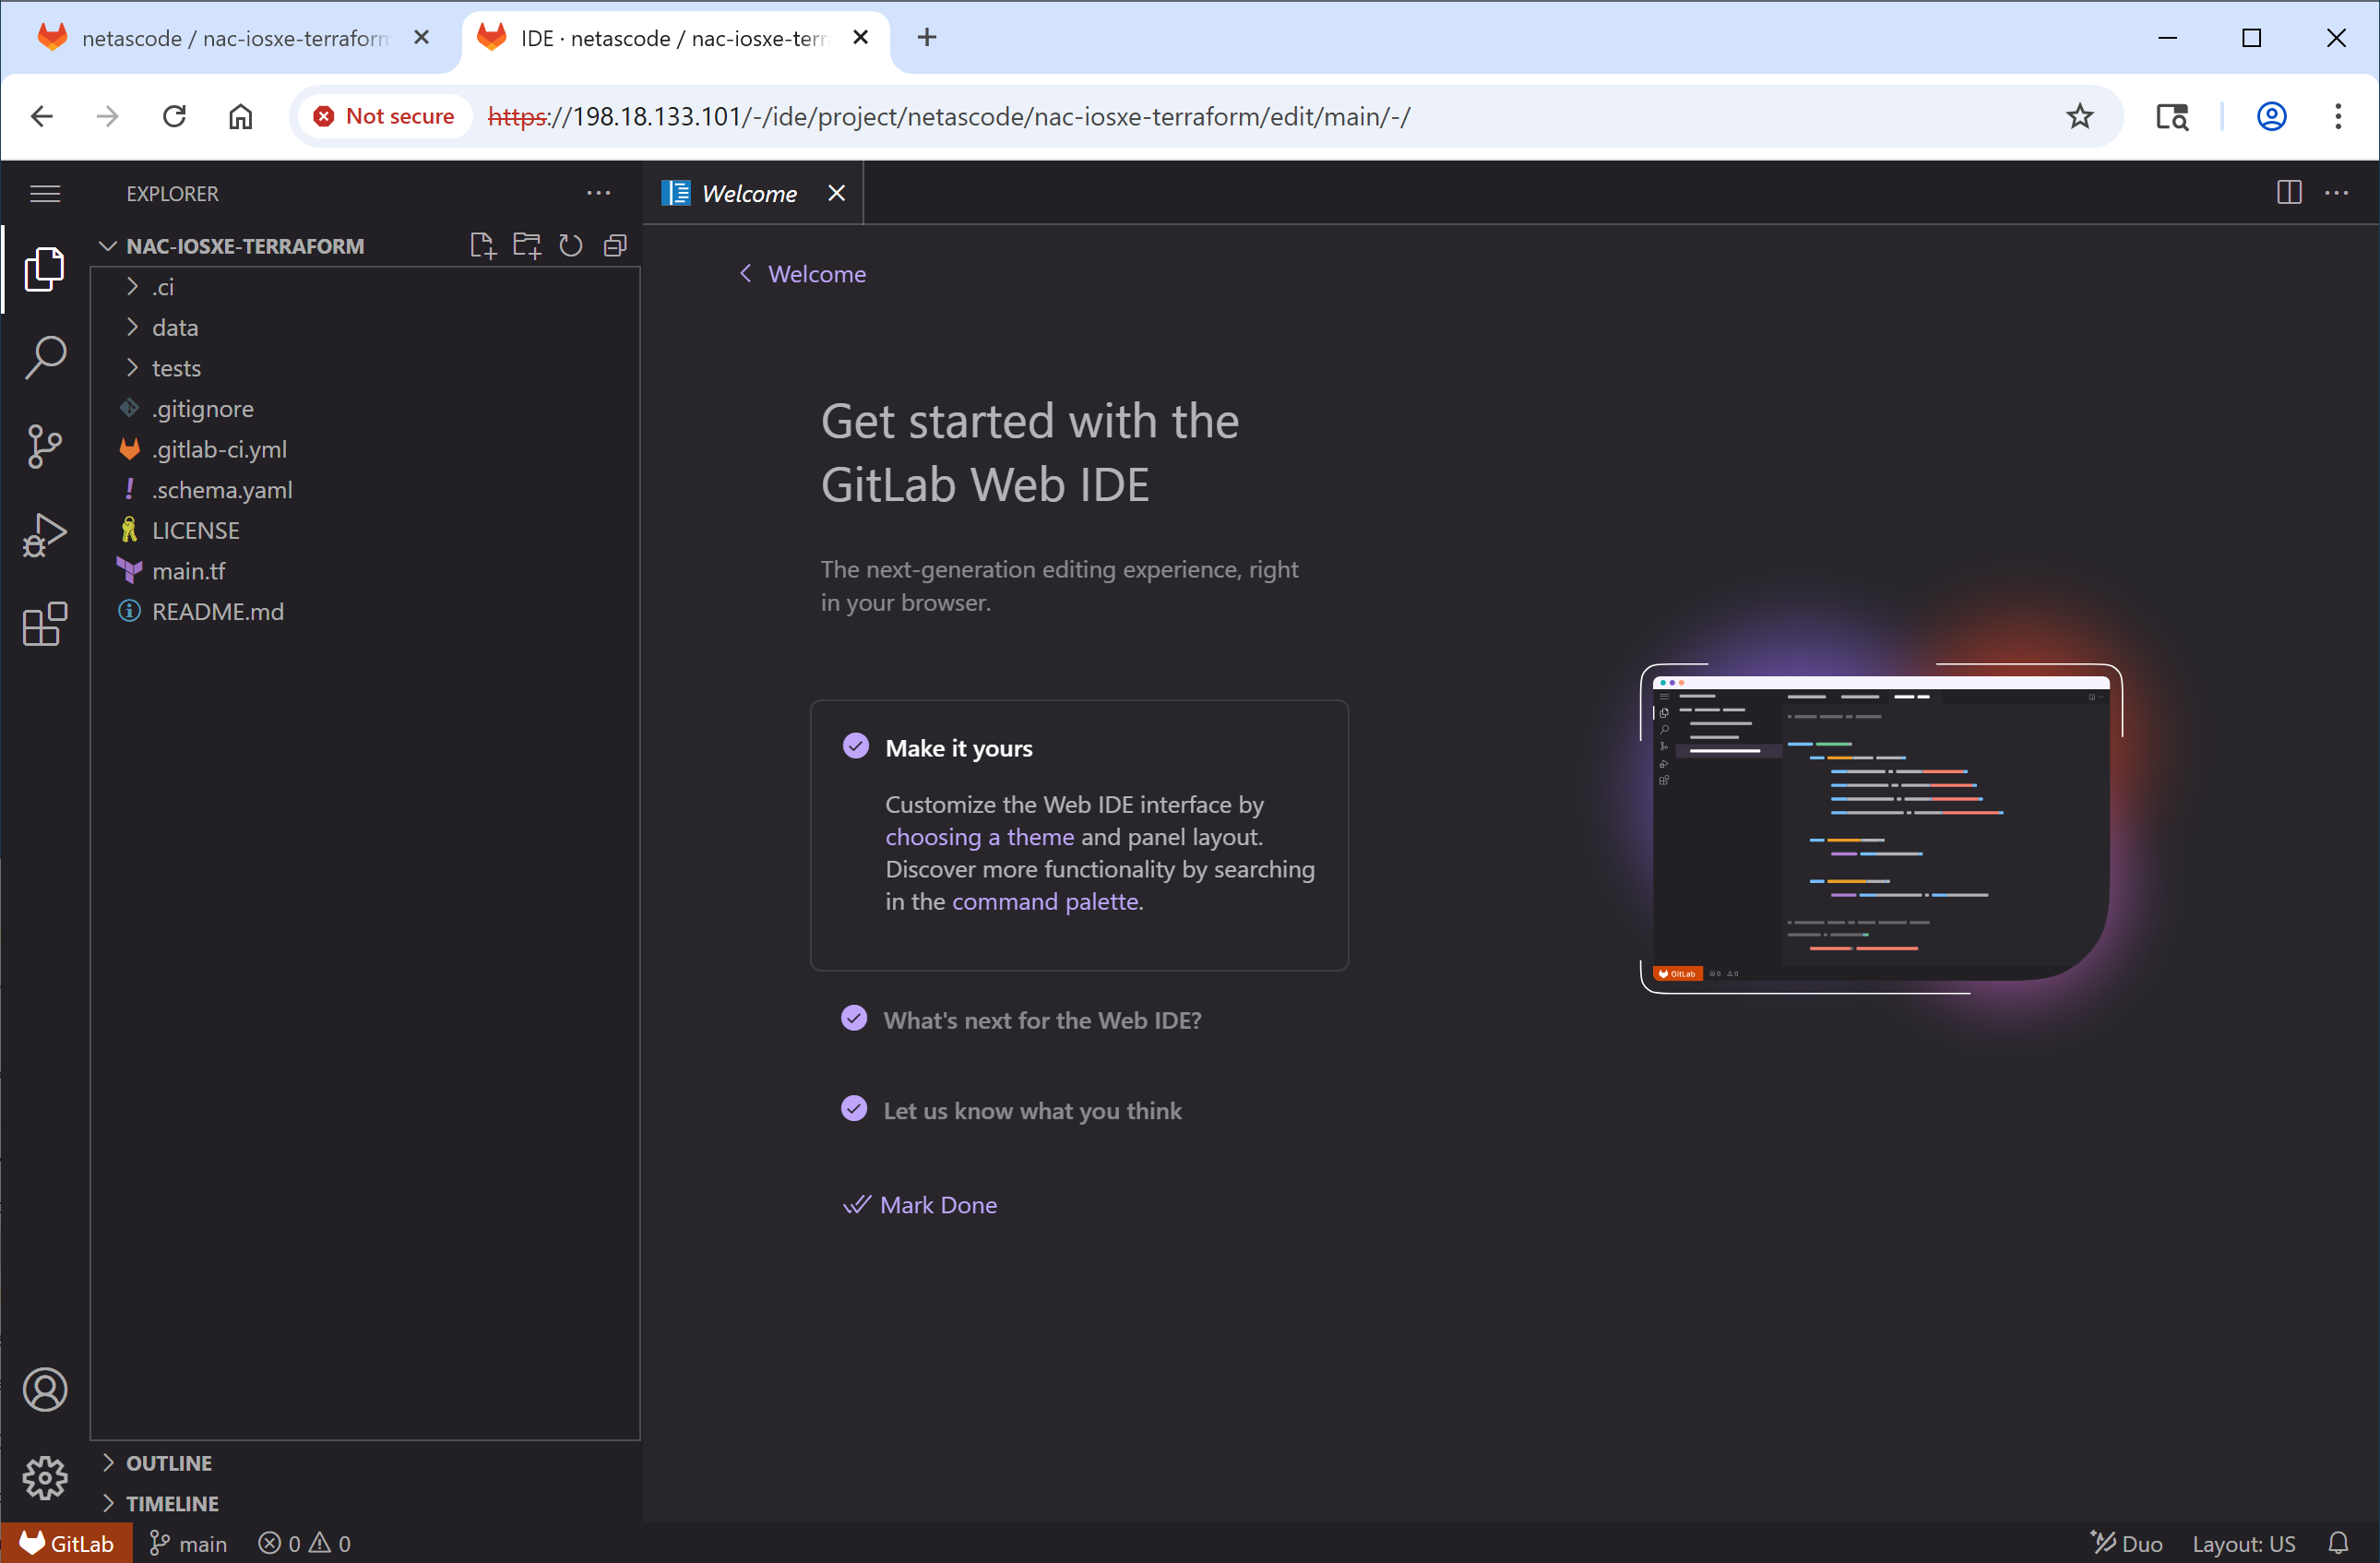
The Web IDE opens with a familiar VS Code-like interface:
Lab configuration files
Take a look at the data/ folder in the file explorer (left panel). This folder contains the same configuration files used in Tasks 2-6. However, some file extensions have been changed from .yaml to .yaml_ (with an underscore at the end). This was done intentionally to ignore these files for now.
.yaml_ vs. .yaml files
The Network as Code framework only uses .yaml files from the yaml_directories defined in main.tf (in our case, the data/ folder). Files with other extensions (like .yaml_) are ignored.
For this task, you'll rename one file (the global config from Tasks 03 and 06) to enable it, and let the pipeline do the rest.
Add global configuration
- In the file explorer (left panel), navigate to the data folder
- Find the file
global.nac.yaml_(note the underscore at the end) - Right-click on the file and select Rename
- Rename the file from
global.nac.yaml_toglobal.nac.yaml(remove the underscore) - Click on the file to open it and inspect the banner content:
---
iosxe:
  global:
    configuration:
      banner:
        login: |
          #########################################
          #                                       #
          #   Welcome to the IOS XE as Code Lab!  #
          #           GitLab - CI/CD              #
          #                                       #
          #########################################
          Device: ${HOSTNAME}
      system:
        hostname: ${HOSTNAME}
Banner Modification
Note that the banner text has been modified to indicate that GitLab CI/CD is now being used.
Optionally, you can also change the banner text to something new, if you'd like.
Step 4: Commit change to trigger pipeline
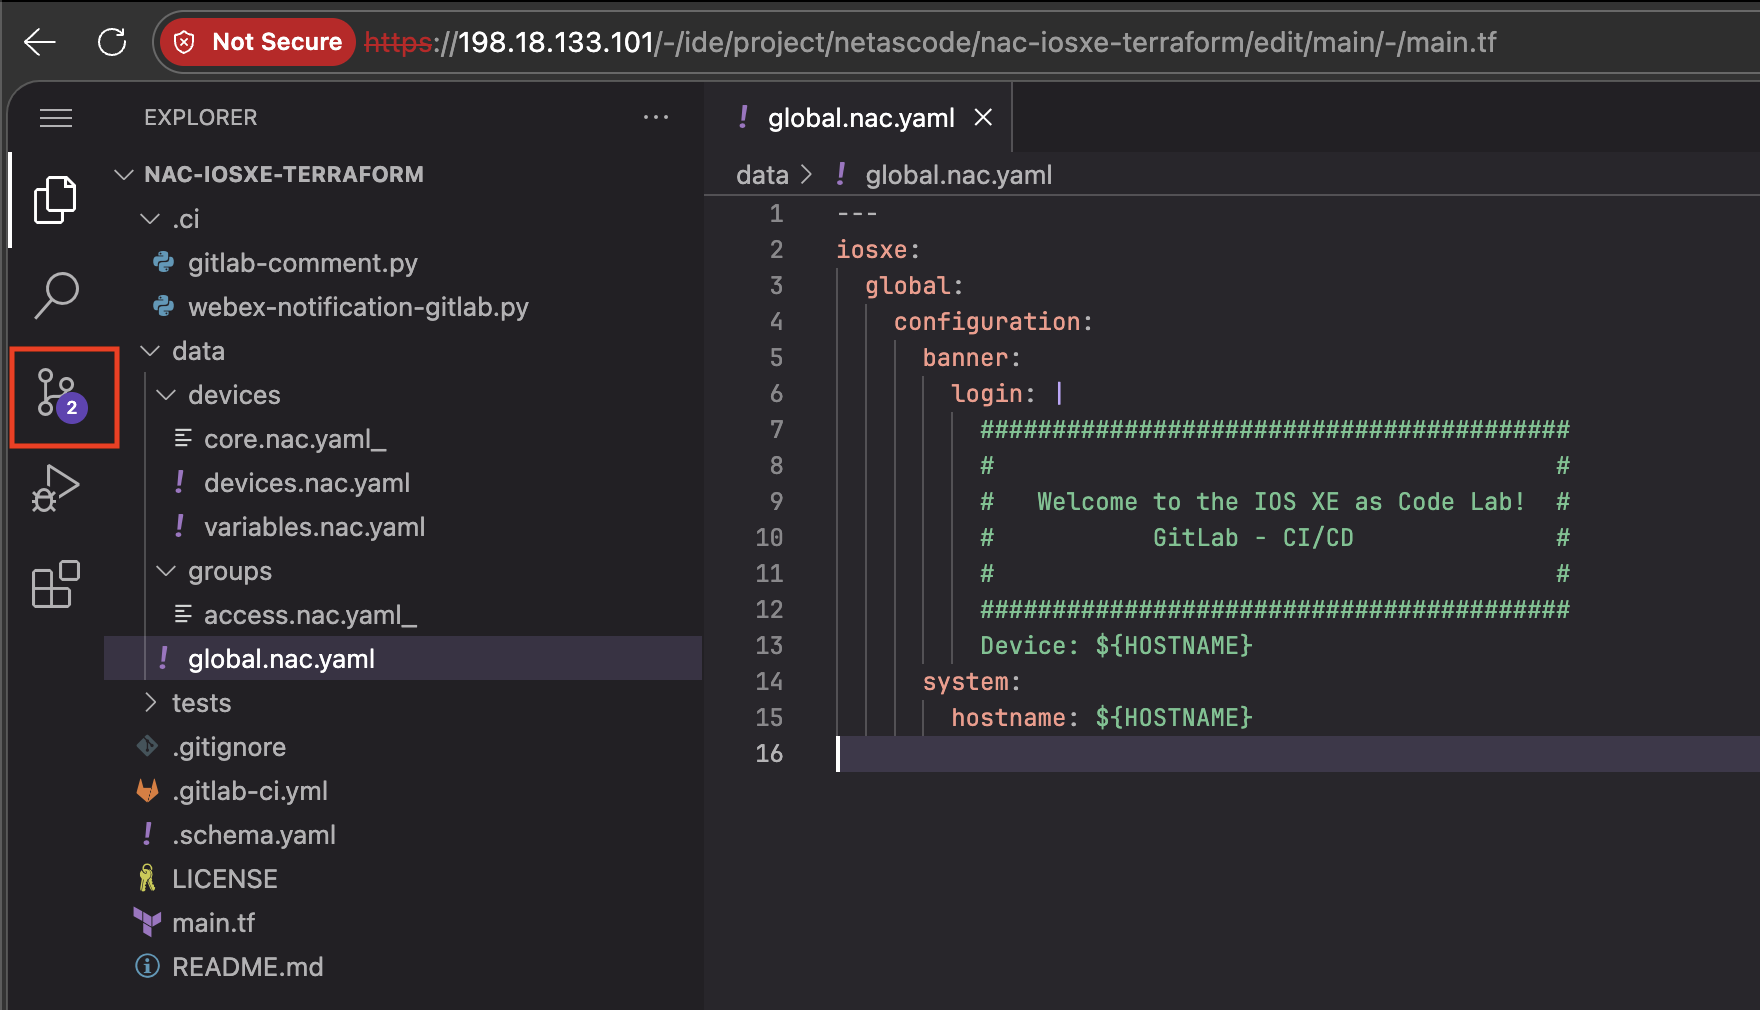
- Click on Source Control icon in the left sidebar
- You'll see your modified file listed
- Enter a commit message:
- Click Commit and push to 'main'
- If prompted with “You're committing your changes to the default branch. Do you want to continue?”. Select Continue.
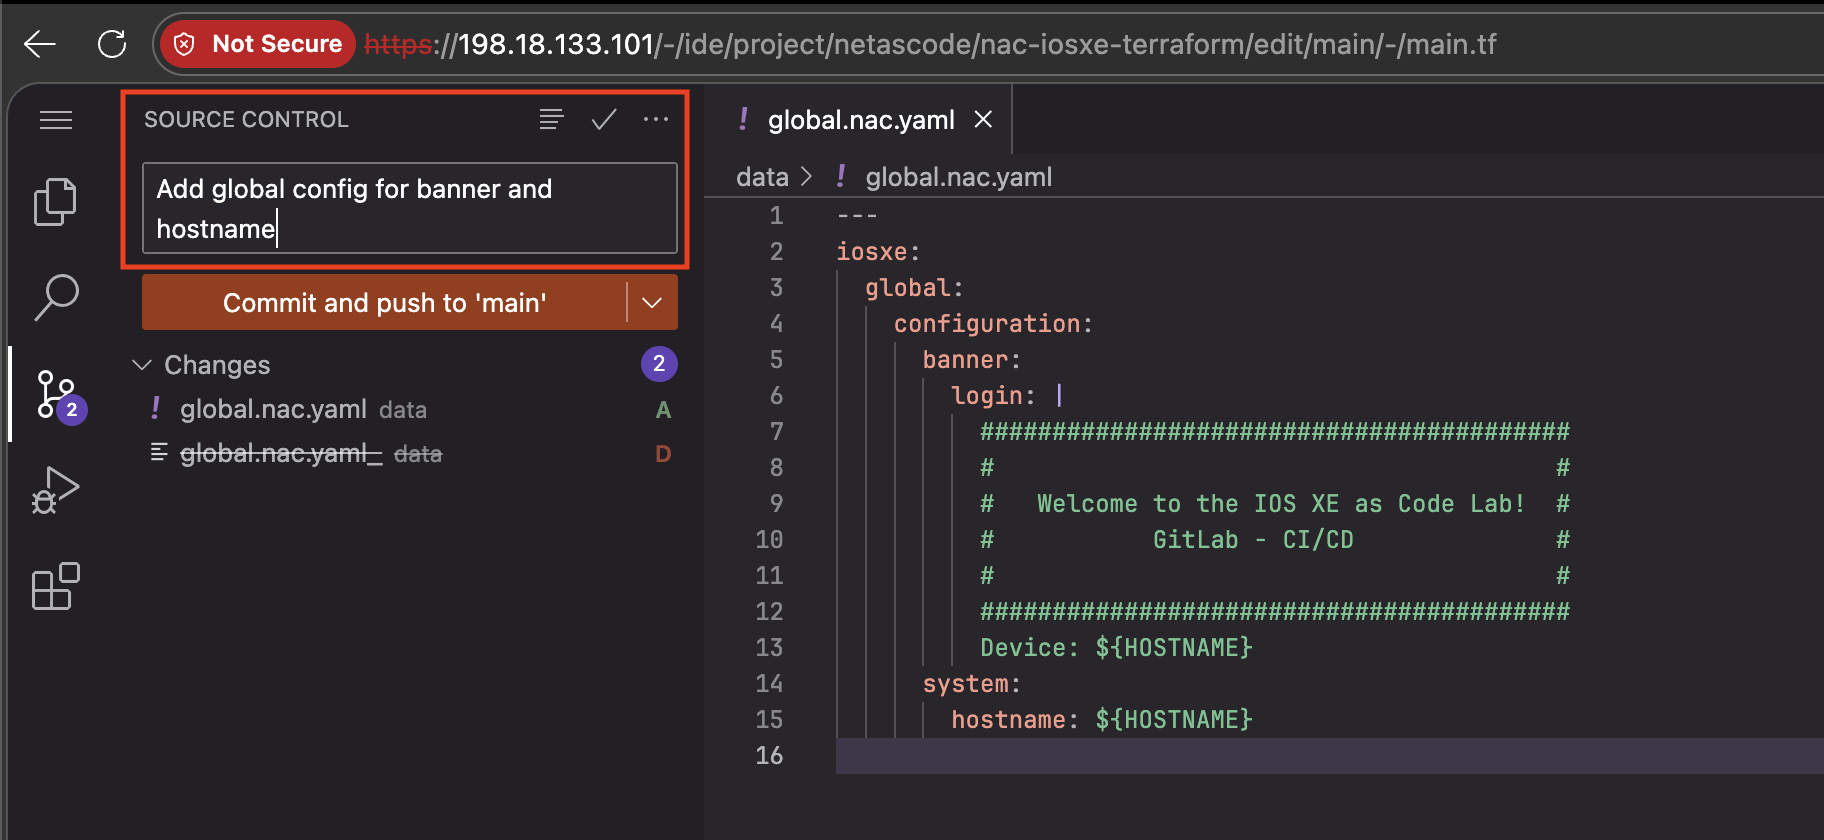
Pipeline Auto-Trigger
When you commit to the main branch, GitLab automatically triggers the CI/CD pipeline. No manual action required!
Step 5: Monitor pipeline execution
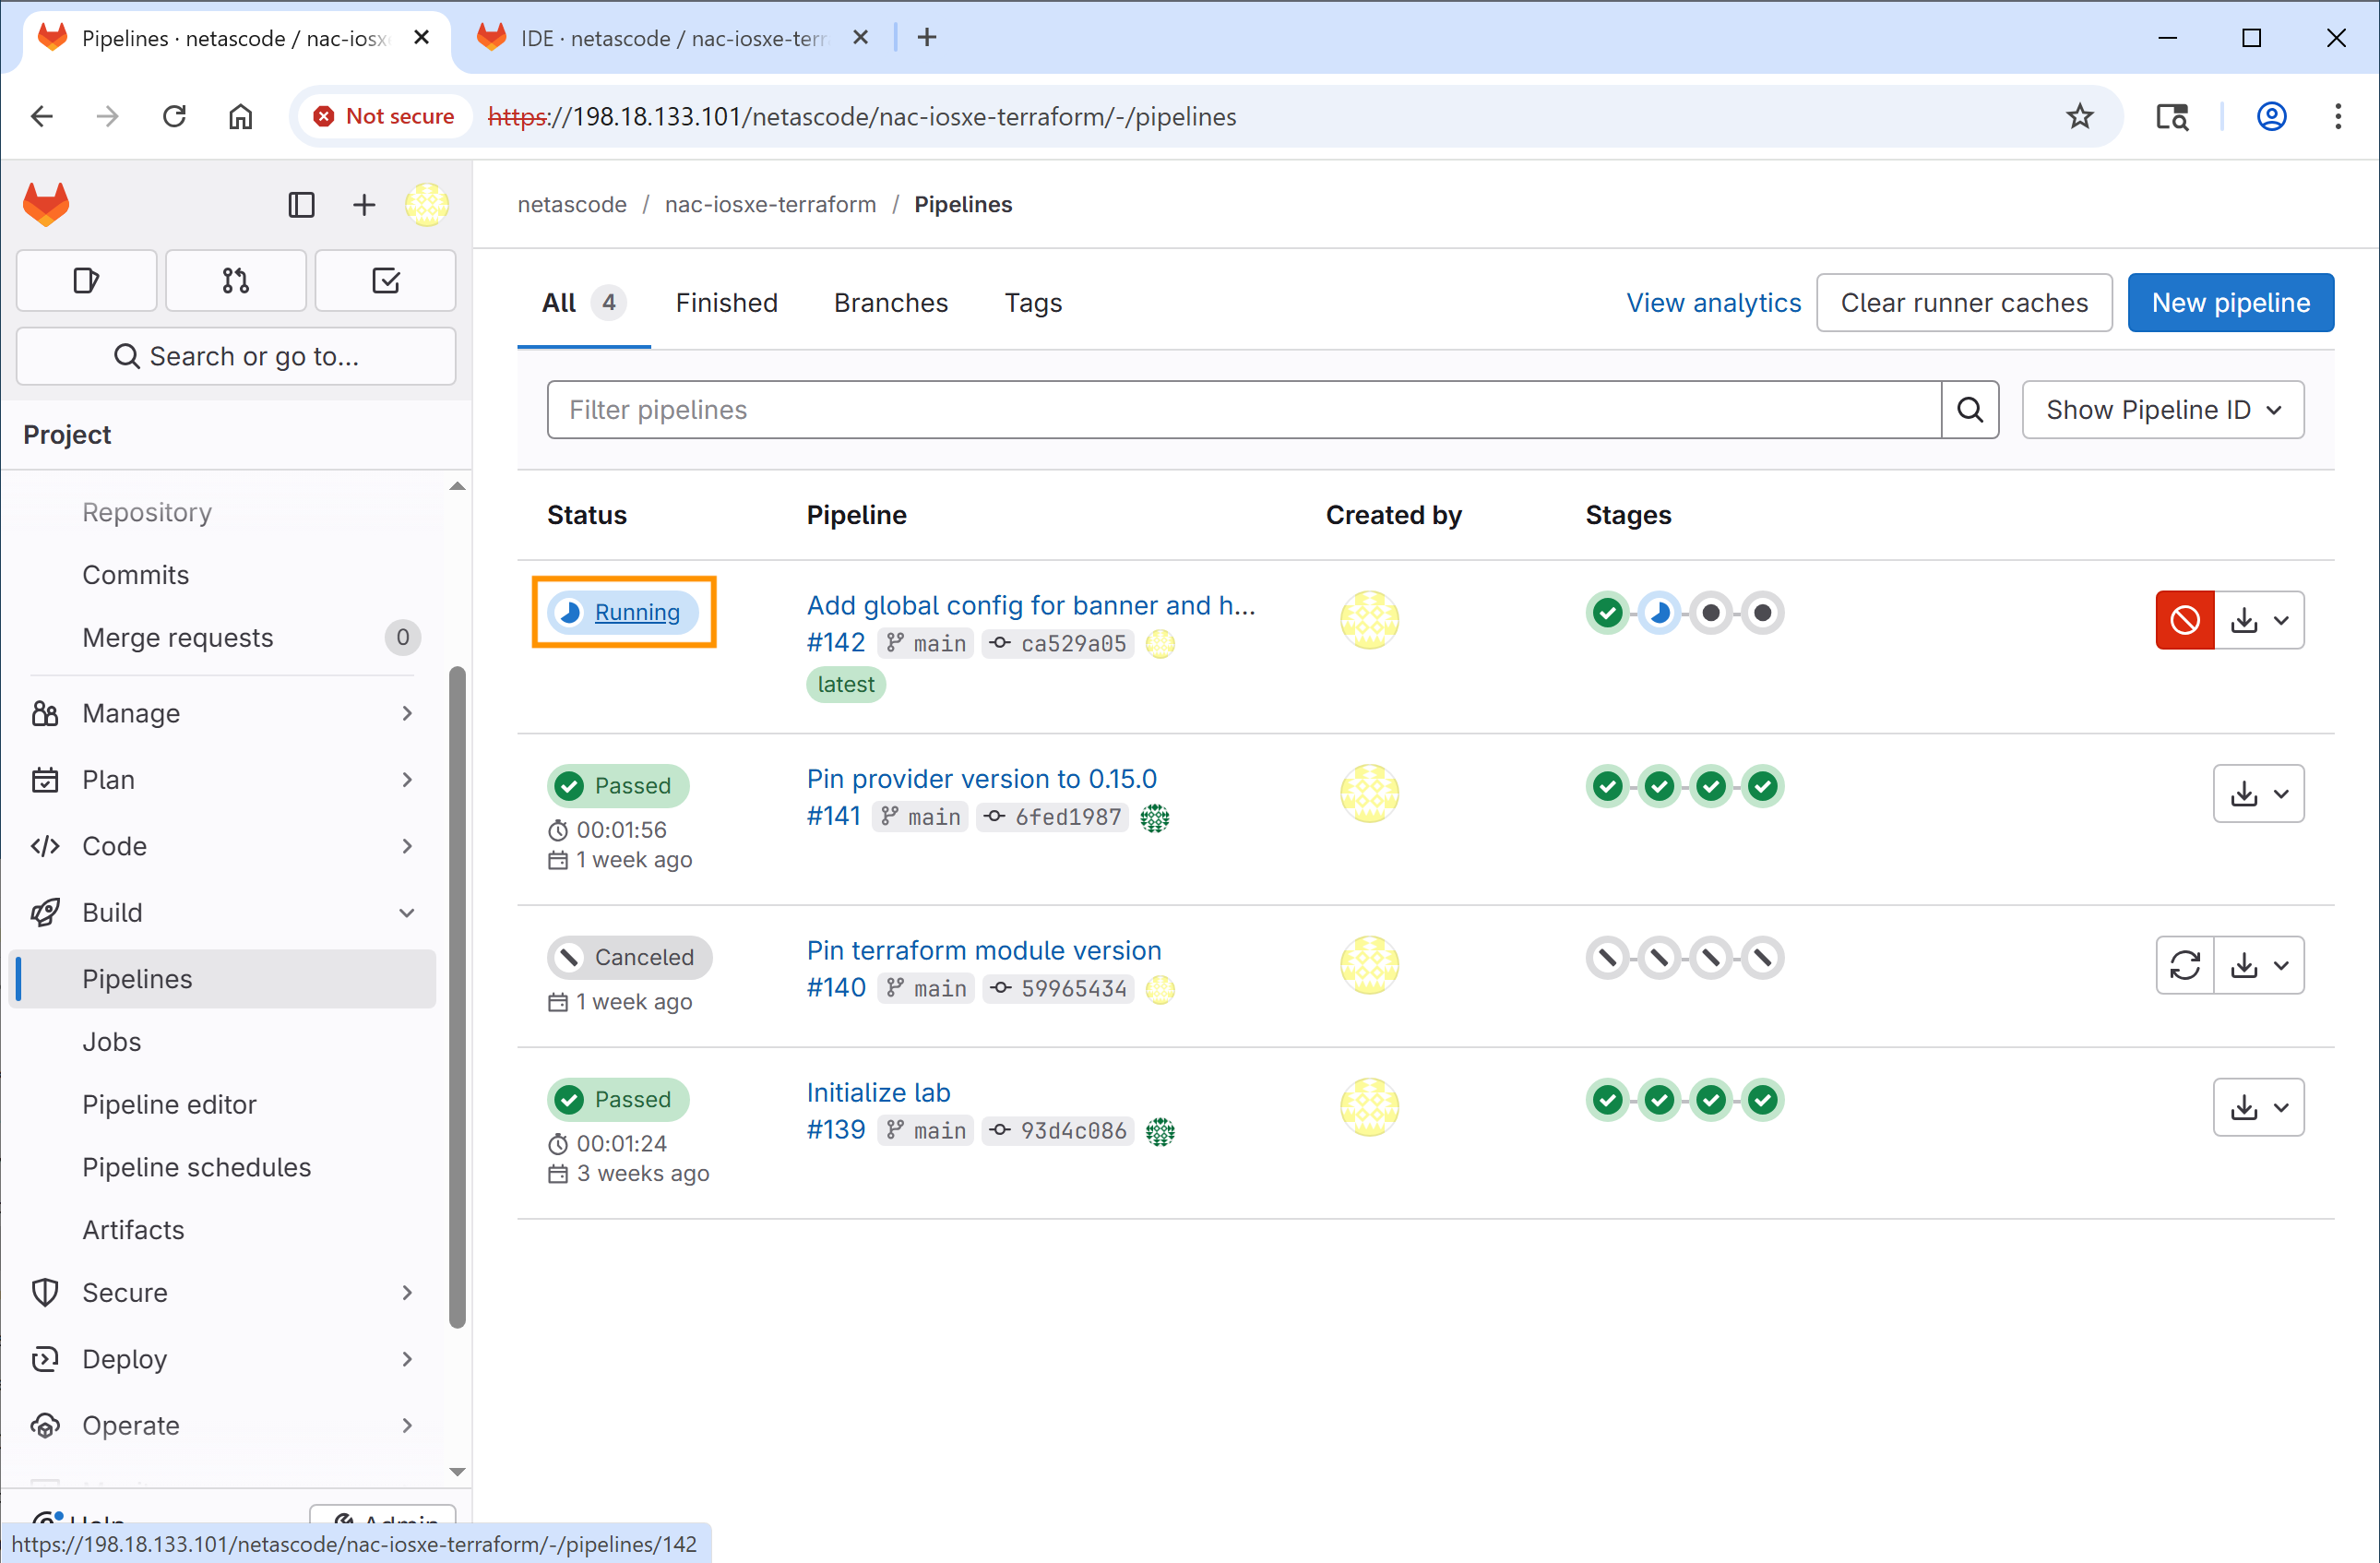
To view the pipeline progress, navigate to Build → Pipelines in the left sidebar, then click on the top pipeline showing running status.
Tip
You need to click on the pipeline status icon or the pipeline ID.
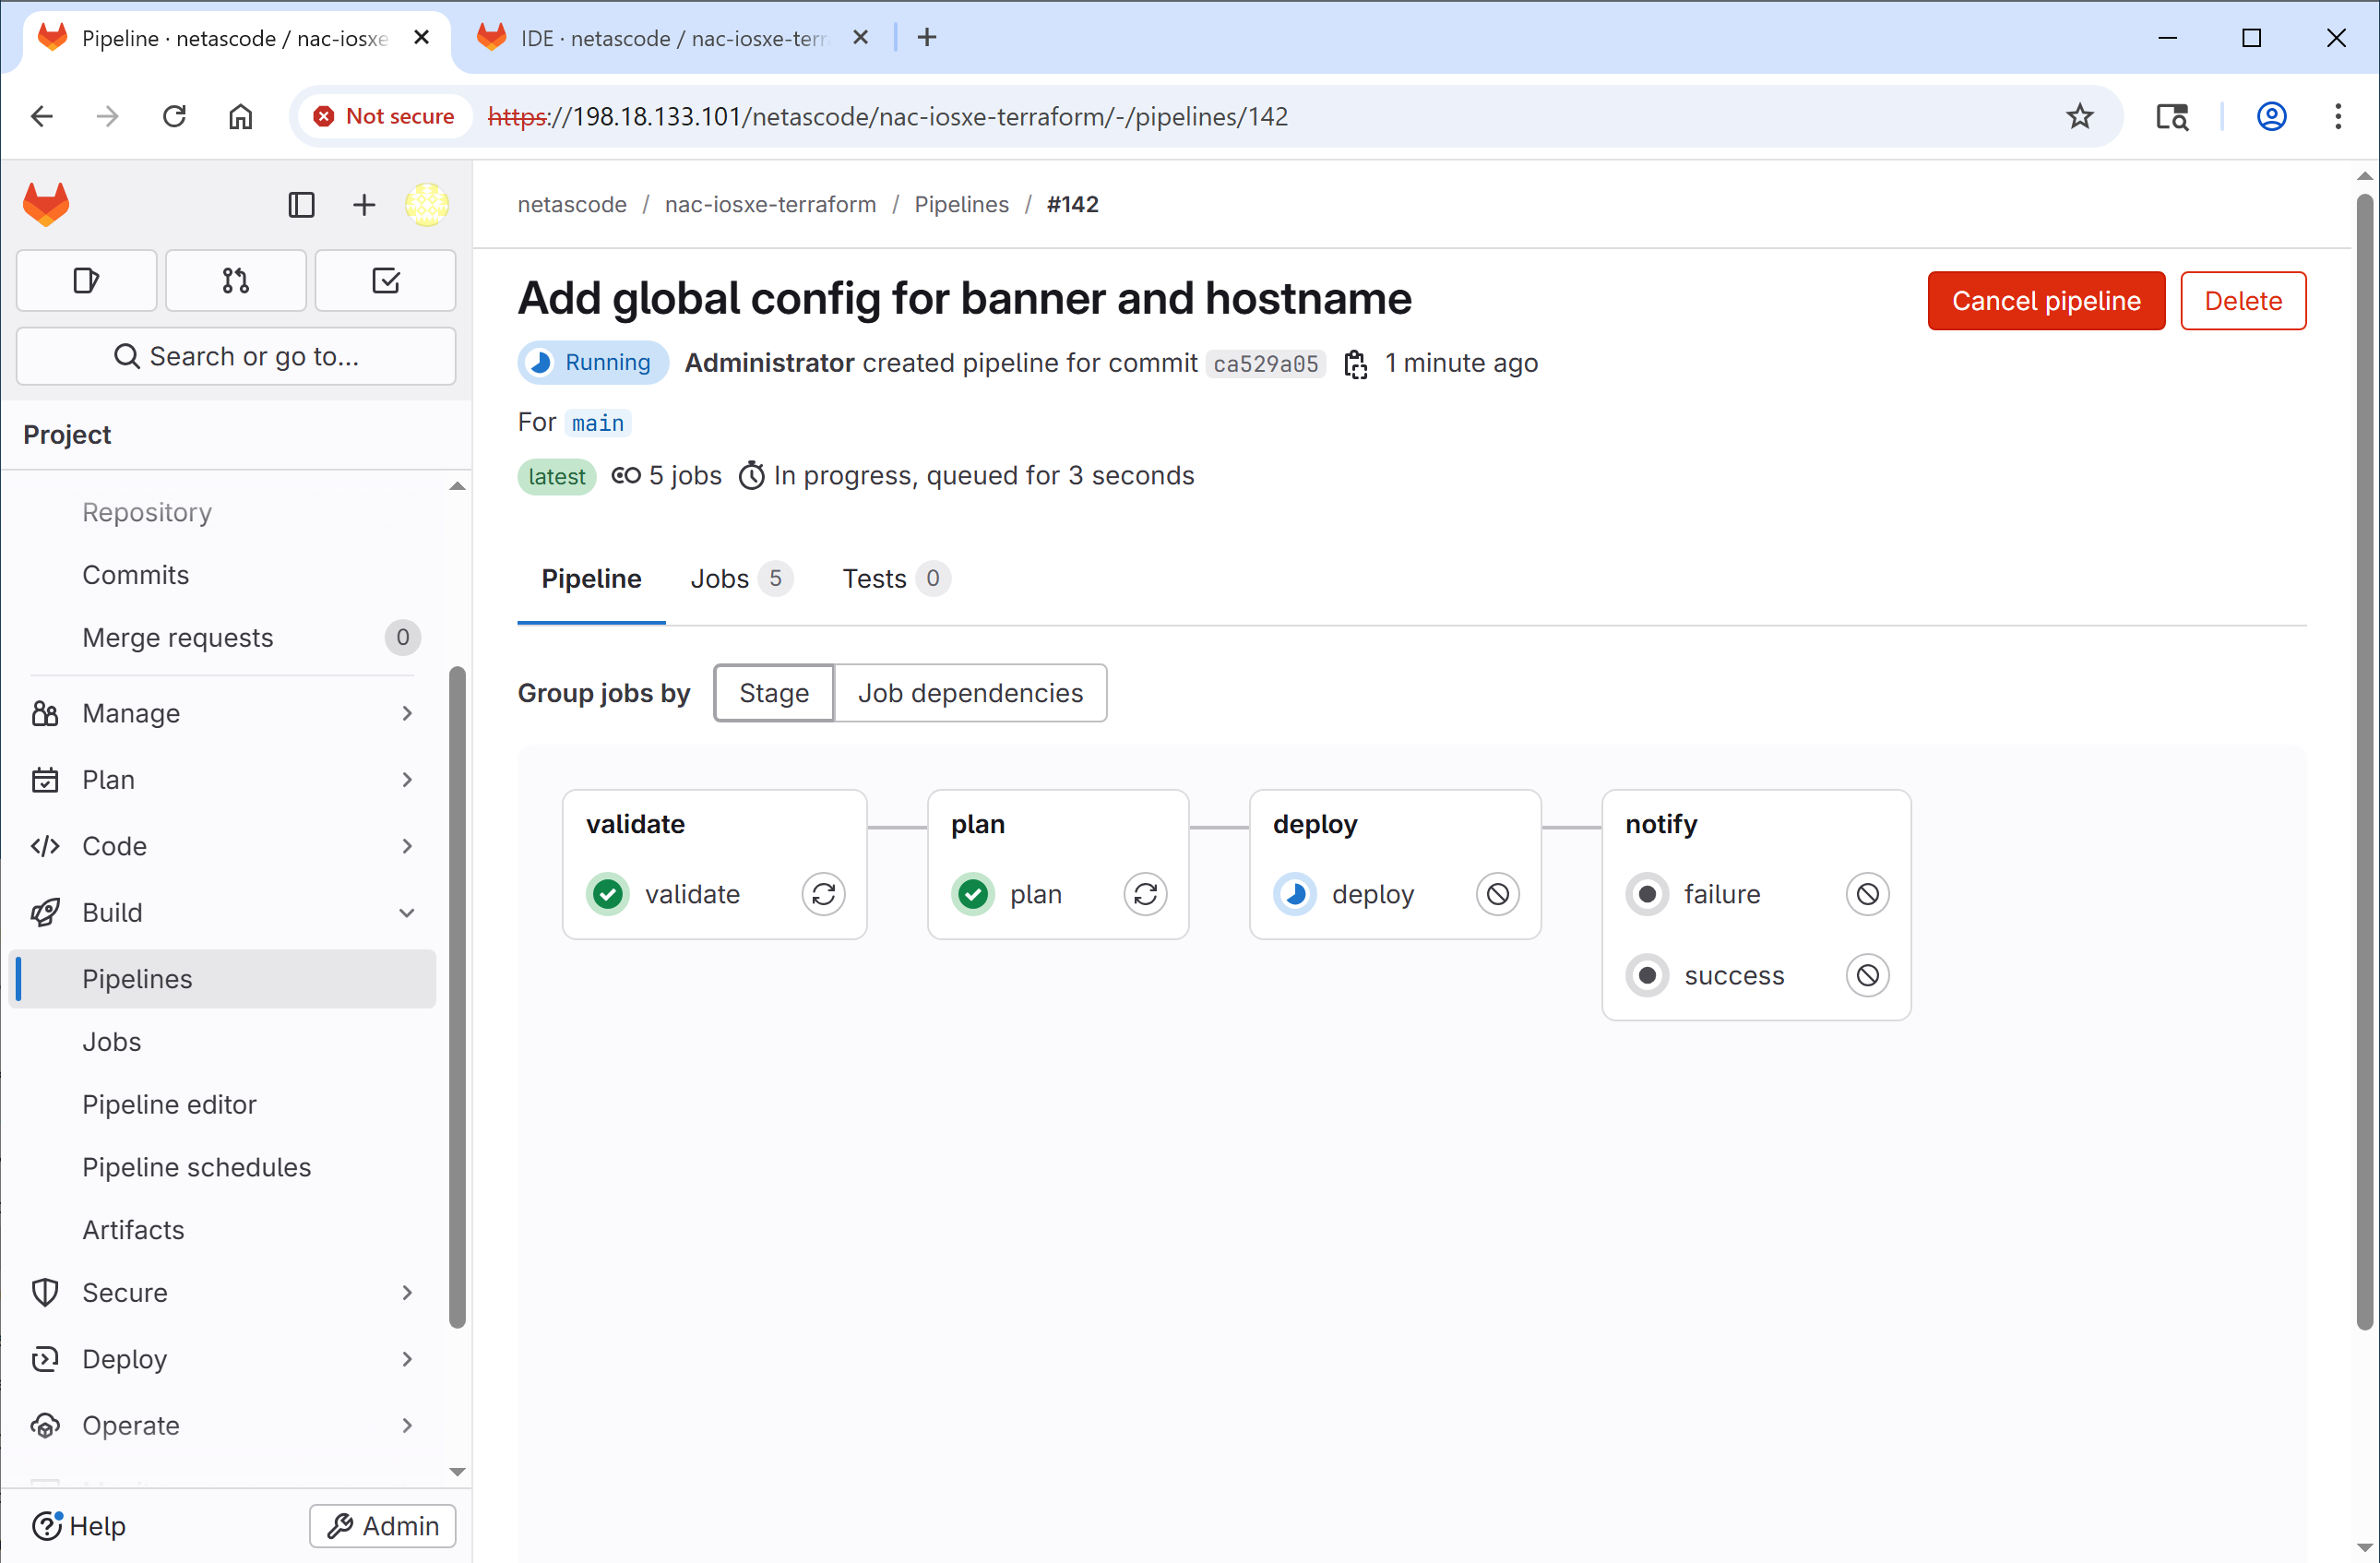
You'll see each stage progressing:
- validate - green checkmark when YAML validation passes. Usually <10s.
- plan - generates the Terraform plan against the live devices. ~30-60s.
- deploy - applies the configuration to the four CML devices over NETCONF. ~60-90s.
- notify - sends success or failure notifications (not used in this lab). <5s.
End-to-end a healthy pipeline run completes in about 2-3 minutes. If the deploy stage sits on "running" for more than 4-5 minutes, one of the CML devices is probably unreachable - click into the job to see the NETCONF error. (The troubleshooting section below covers the most common causes.)
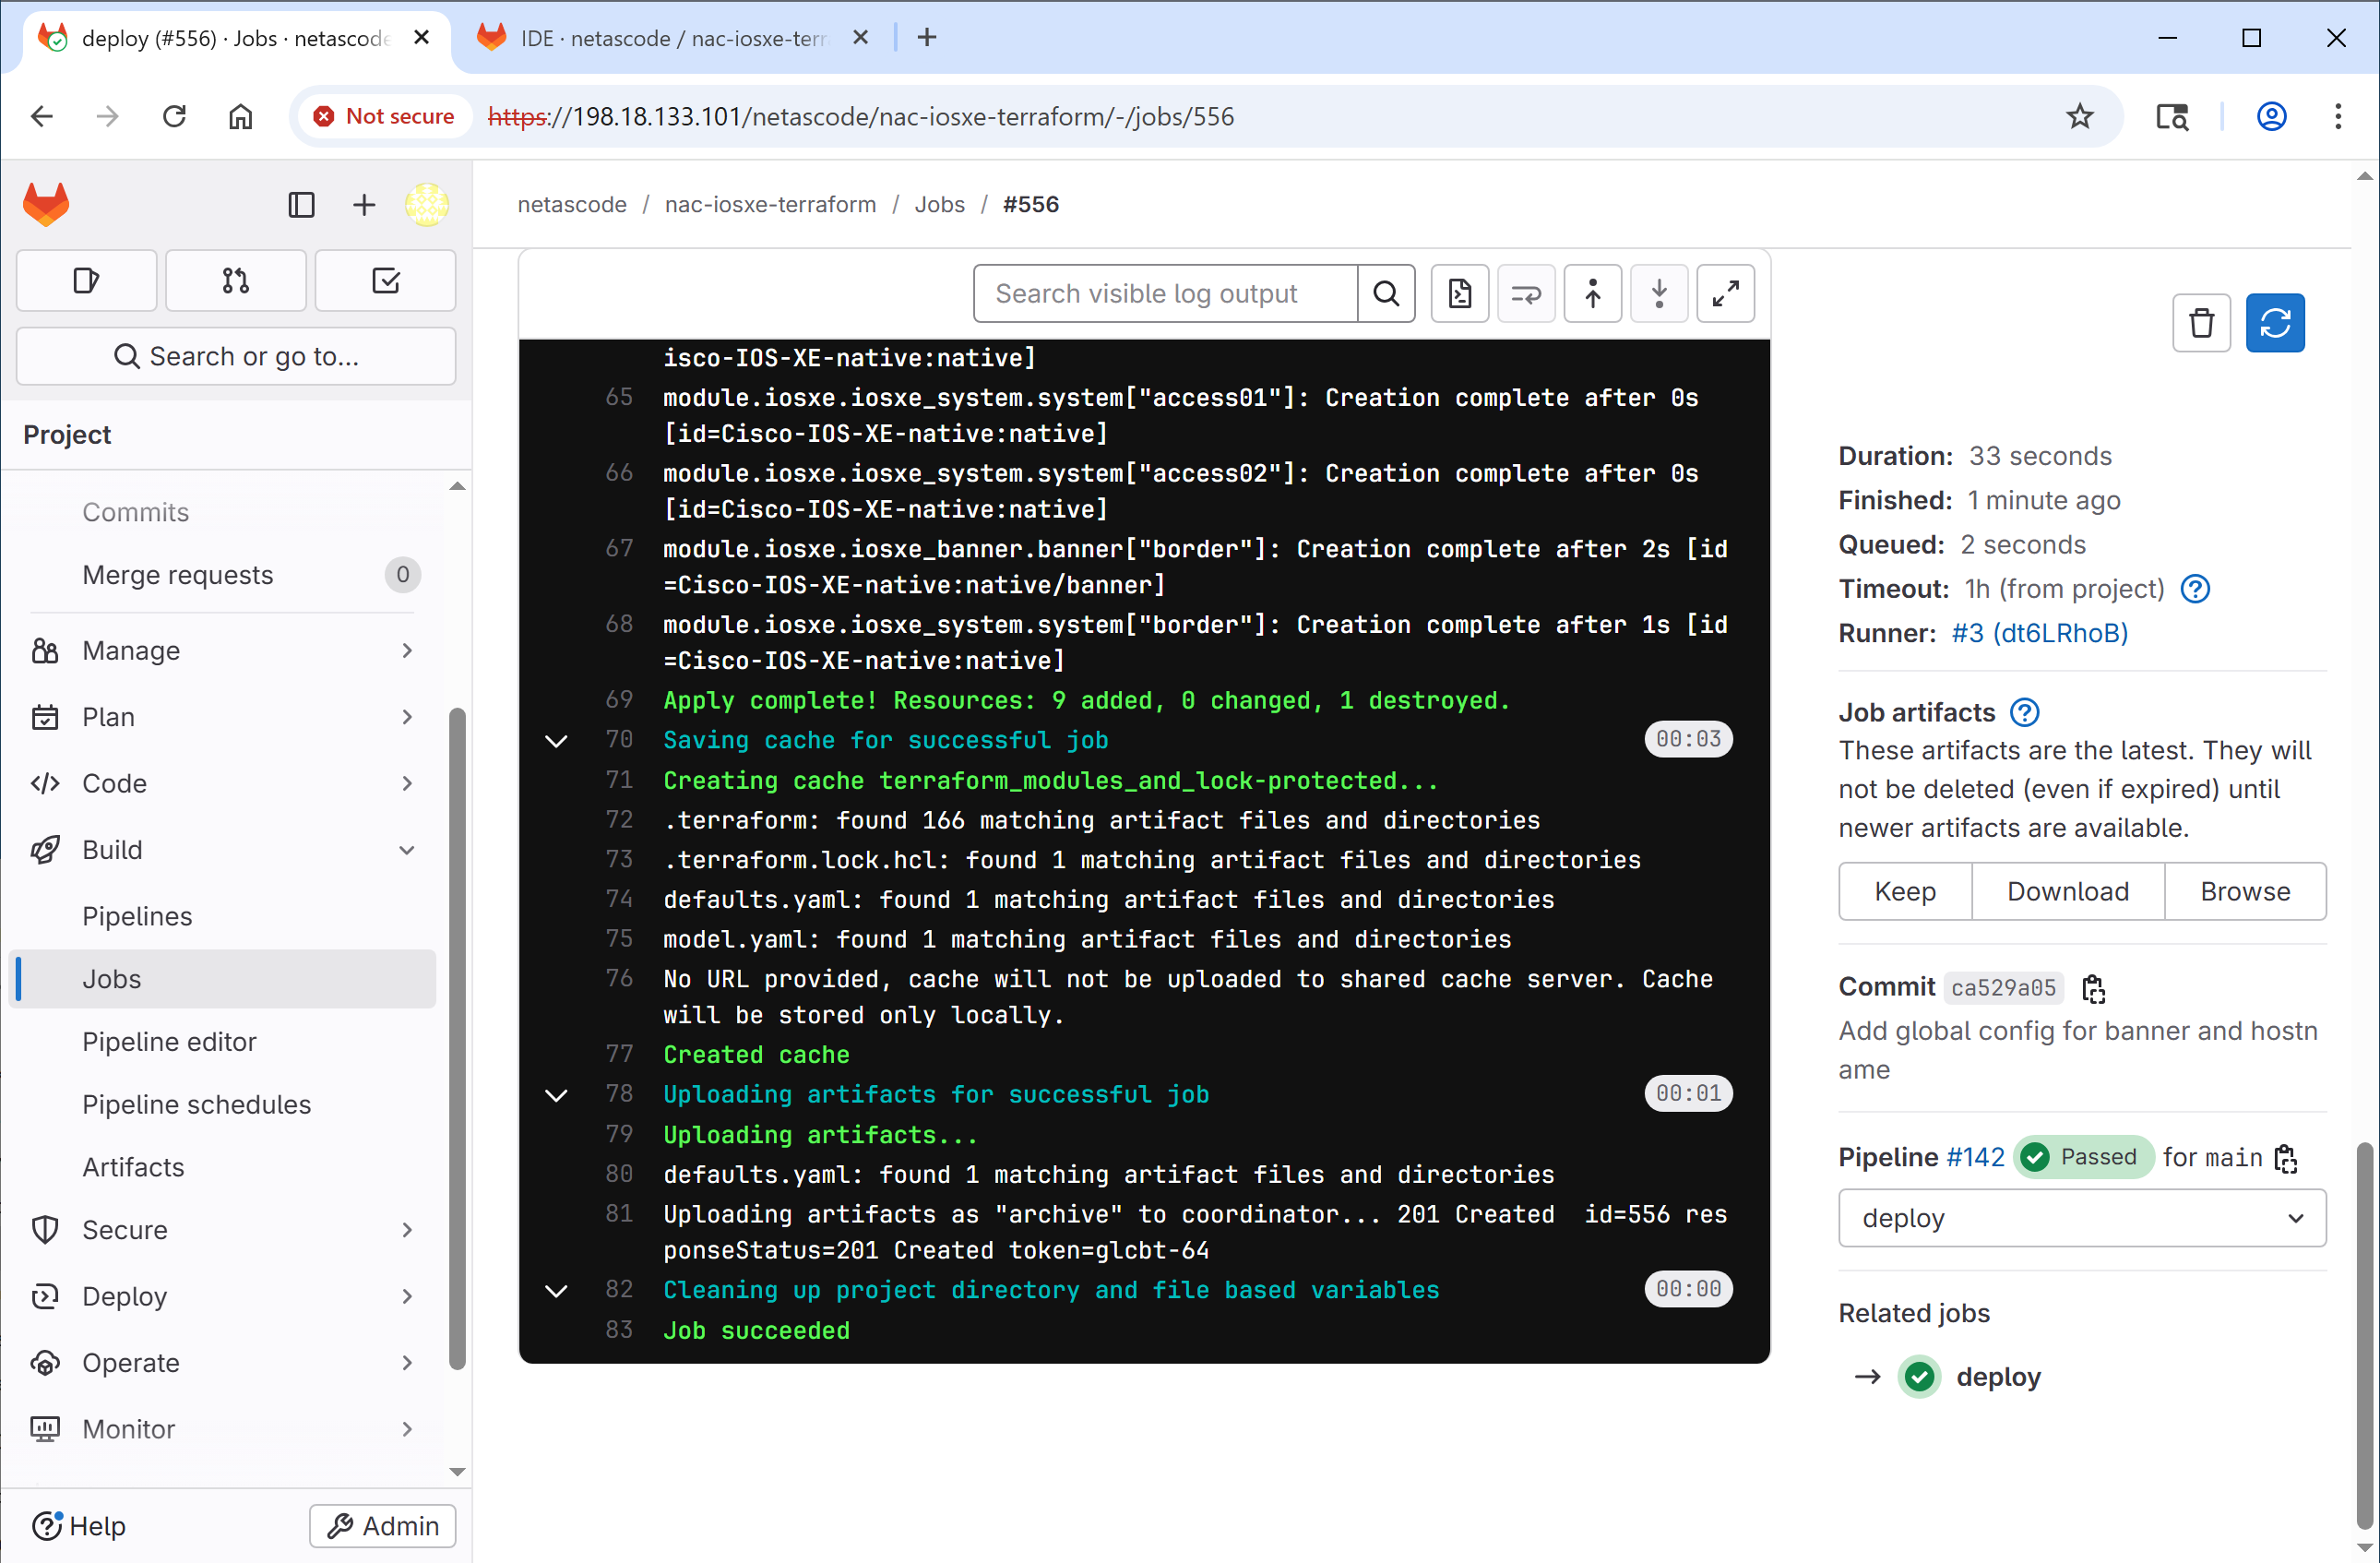
Click on any stage to view its detailed logs.
Step 6: Verify pipeline success
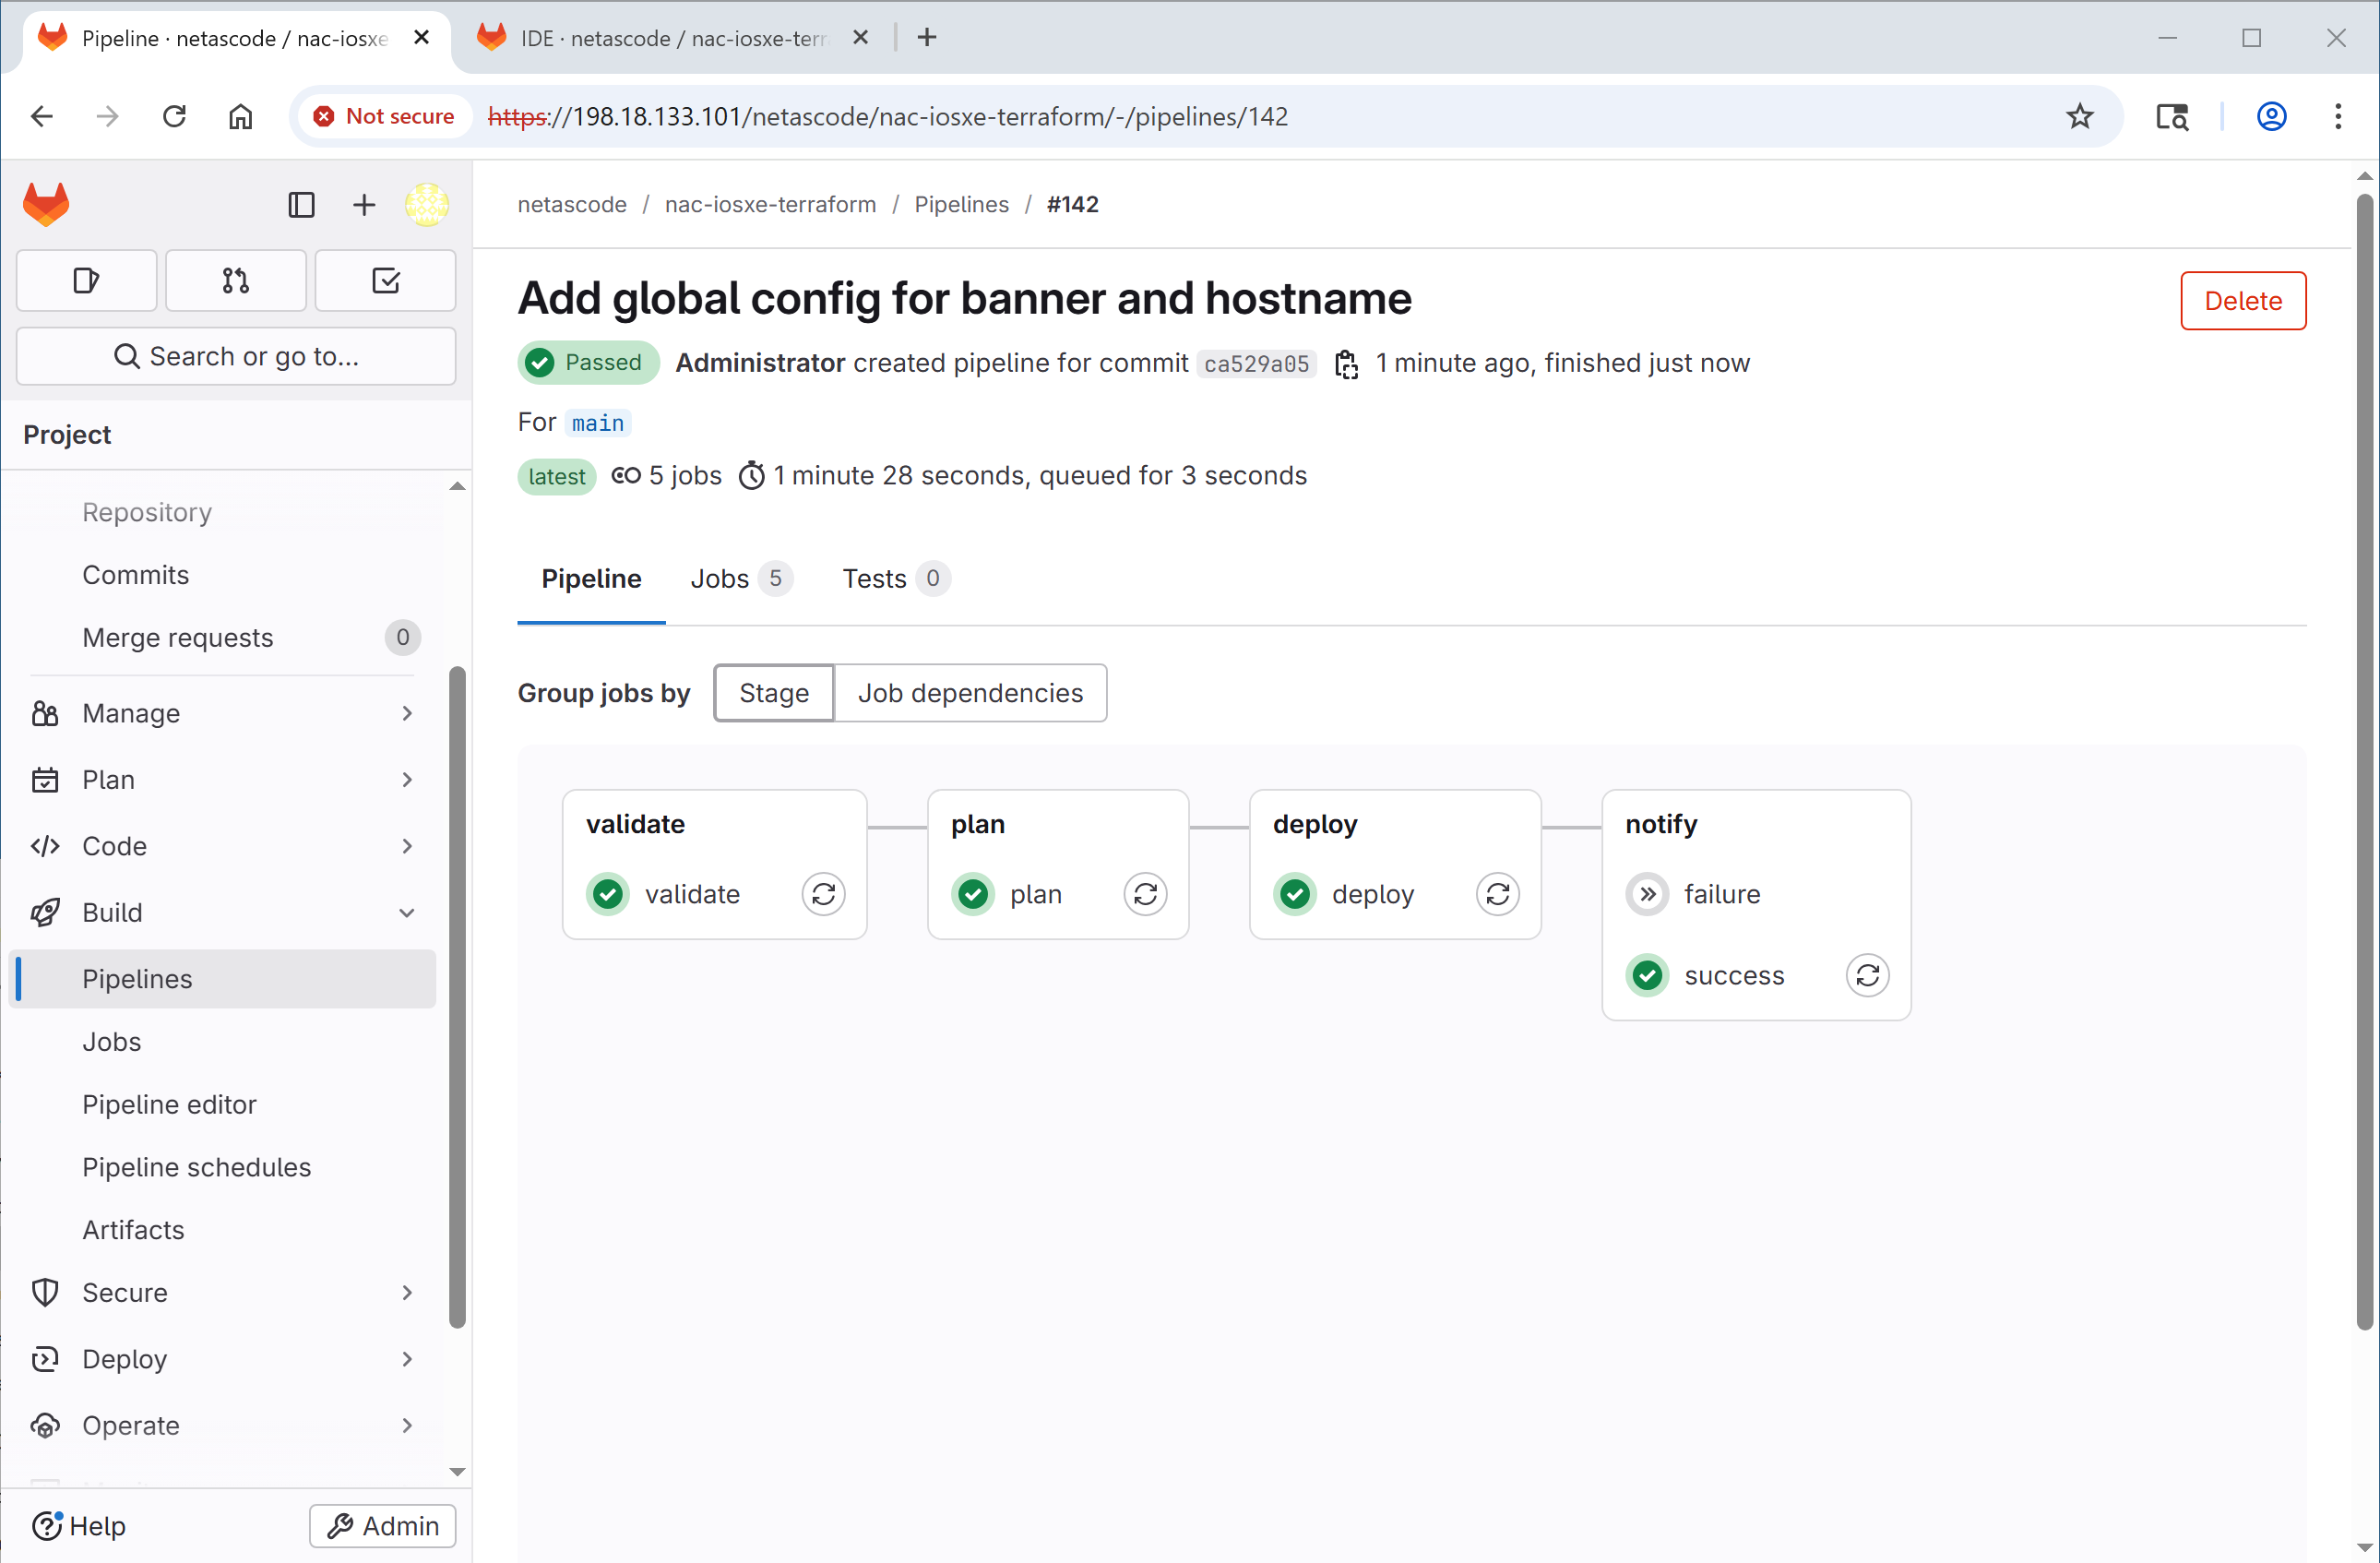
When all stages complete successfully, the pipeline shows a green passed status.
Verify the deploy job actually changed the devices
A green pipeline only tells you the stages finished without error - it doesn't by itself prove the devices changed. A no-op deploy (running on a state that already matches intent) also shows green. To confirm Terraform actually pushed something, click into the deploy job and scroll to the end of the log. You're looking for a line like:
- Resources > 0 in
addedorchanged- the devices were modified. - All zeros - the pipeline ran against a state that already matched;
nothing was pushed. That's fine, but if you expected a change, verify
your commit made it into
mainand re-trigger the pipeline.
This log-based check is more reliable than looking at device output because it comes straight from the Terraform engine's own accounting.
Spot-check a device (optional but satisfying)
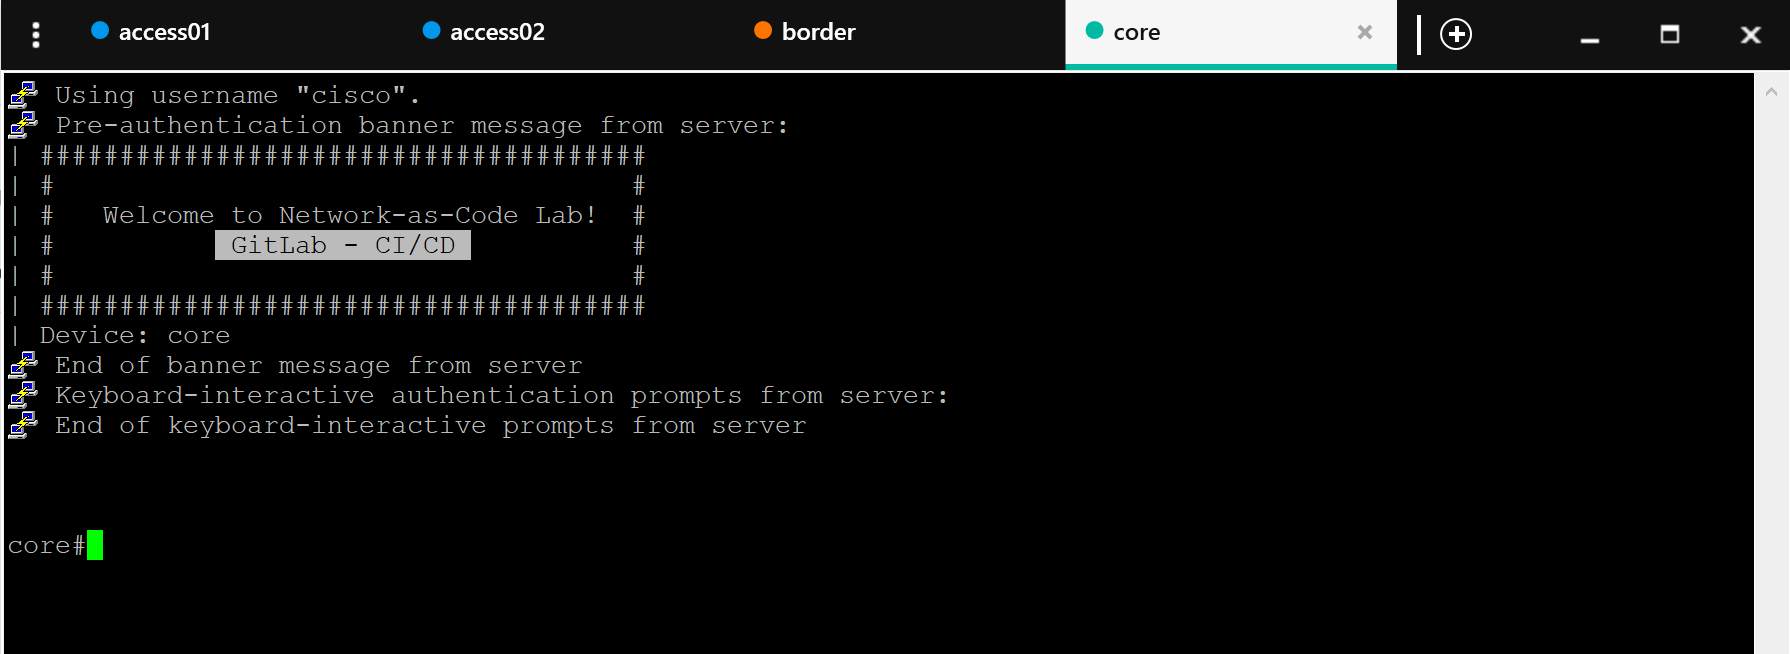
- Open Solar-PuTTY from your desktop
- Connect to one of the devices (e.g., core switch)
- Check the banner and hostname - The banner will now include
GitLab - CI/CD
Validation test (optional)
Additionally, you can test the validation stage by introducing an error in the configuration, just like in Task 10 - Schema Validation.
If the validation fails, the pipeline will stop, and you'll see a red failed status.
Troubleshooting common pipeline failures
If your pipeline shows a red failed status, click into the failing job to see the logs. Here are the failure modes you're most likely to hit during the lab:
nac-validate reports a schema error
Symptom: The validate stage fails with an ERROR - Syntax error 'data/…' message.
Fix: Open the file named in the error and fix the reported issue. Schema errors in the pipeline are the same errors you'd see running nac-validate locally - same tool, same rules. Refer back to Task 10 - Schema Validation for the full error catalog and fix patterns.
terraform plan or apply can't reach the devices
Symptom: deploy stage fails with an error mentioning dial tcp, connection refused, or Error: Connection to host failed.
Likely causes (in order of frequency):
IOSXE_USERNAME/IOSXE_PASSWORDvariables weren't supplied when you ran the pipeline. Re-run with Run pipeline and fill in the credentials.- The CML lab devices are down. Check CML UI and restart the stopped node.
- Wrong
IOSXE_PROTOCOLvalue. Should benetconffor this lab (orrestconfif you opted out). Anything else, and the provider won't know how to talk to the device.
terraform apply fails with Error acquiring the state lock
Symptom: deploy stage fails with Error acquiring the state lock and a lock ID.
Fix: An earlier pipeline run died mid-apply and left the HTTP backend state locked. Unlock it from the command line:
Or, from GitLab: Operate → Terraform states → nac-iosxe-terraform → Remove lock.
Then re-run the pipeline. Only do this if you're confident no other apply is actually in progress - force-unlocking a live apply will corrupt state.
Pipeline blocked: "You cannot push to this protected branch"
Symptom: The commit is rejected before the pipeline even starts.
Fix: The target branch is protected (see Task 15). Create a feature branch instead, push to it, open a merge request. This is expected behavior once protected-branch rules are in place - it's the system telling you to use the MR workflow.
Need more signal? Turn on Terraform's debug log
When a pipeline job logs a generic "apply failed" without naming the offender, re-run the job with Terraform's debug output. Add two env vars to the pipeline run (Run pipeline → custom variables):
TF_LOG=DEBUG prints every RPC the provider makes, including the NETCONF XML payloads. TF_LOG_PATH writes the same output to a file you can attach as a CI job artifact - much more usable than scrolling through the job log. Other levels: TRACE (noisier), INFO, WARN, ERROR.
Locally, the same env vars work in your shell: TF_LOG=DEBUG terraform plan. Turn it off (unset TF_LOG) once you've found the problem - debug output is verbose.
What you've accomplished
- ✅ Accessed GitLab and navigated to the NaC-IOSXE project
- ✅ Understood the CI/CD pipeline configuration
- ✅ Triggered a pipeline by committing a change
- ✅ Monitored pipeline execution through all stages
What's next
Tasks 14 and 15 are optional - Task 14 extends the pipeline with integration and idempotency tests; Task 15 introduces merge-request workflows with protected branches. If you're at the end of your time box, skip straight to the Conclusion.
← Previous: Task 12 - Cleanup · Next: Task 14 - Extend CI/CD pipeline